Abstract
According to the 2019 annual report of China’s Paper Industry by China Paper Association (CPA), in 2019, there were about 2700 paper & board manufacturers in mainland China. The total production of paper & board was 107.65 million tons, increased by 3.16% and the total consumption was 107.04 million tons, increased by 2.54% compared with 2018, respectively, paper & board per capita consumption was 75 kg (counted in 1.4 billion people). This report includes a rather elaborate analysis of the China’s paper industry and is provided for the readers’ reference.
According to the survey made by China Paper Association (CPA), in 2019, there were about 2700 paper & board manufacturers in mainland China. The total production of paper & board was 107.65 million tons, increased by 3.16% and the total consumption was 107.04 million tons, increased by 2.54% compared with 2018, respectively, paper & board per capita consumption was 75 kg. From 2010 to 2019, the average annual growth rate of paper & board production was 1.68%, and the average annual growth rate of paper & board consumption was 1.73%, as shown in
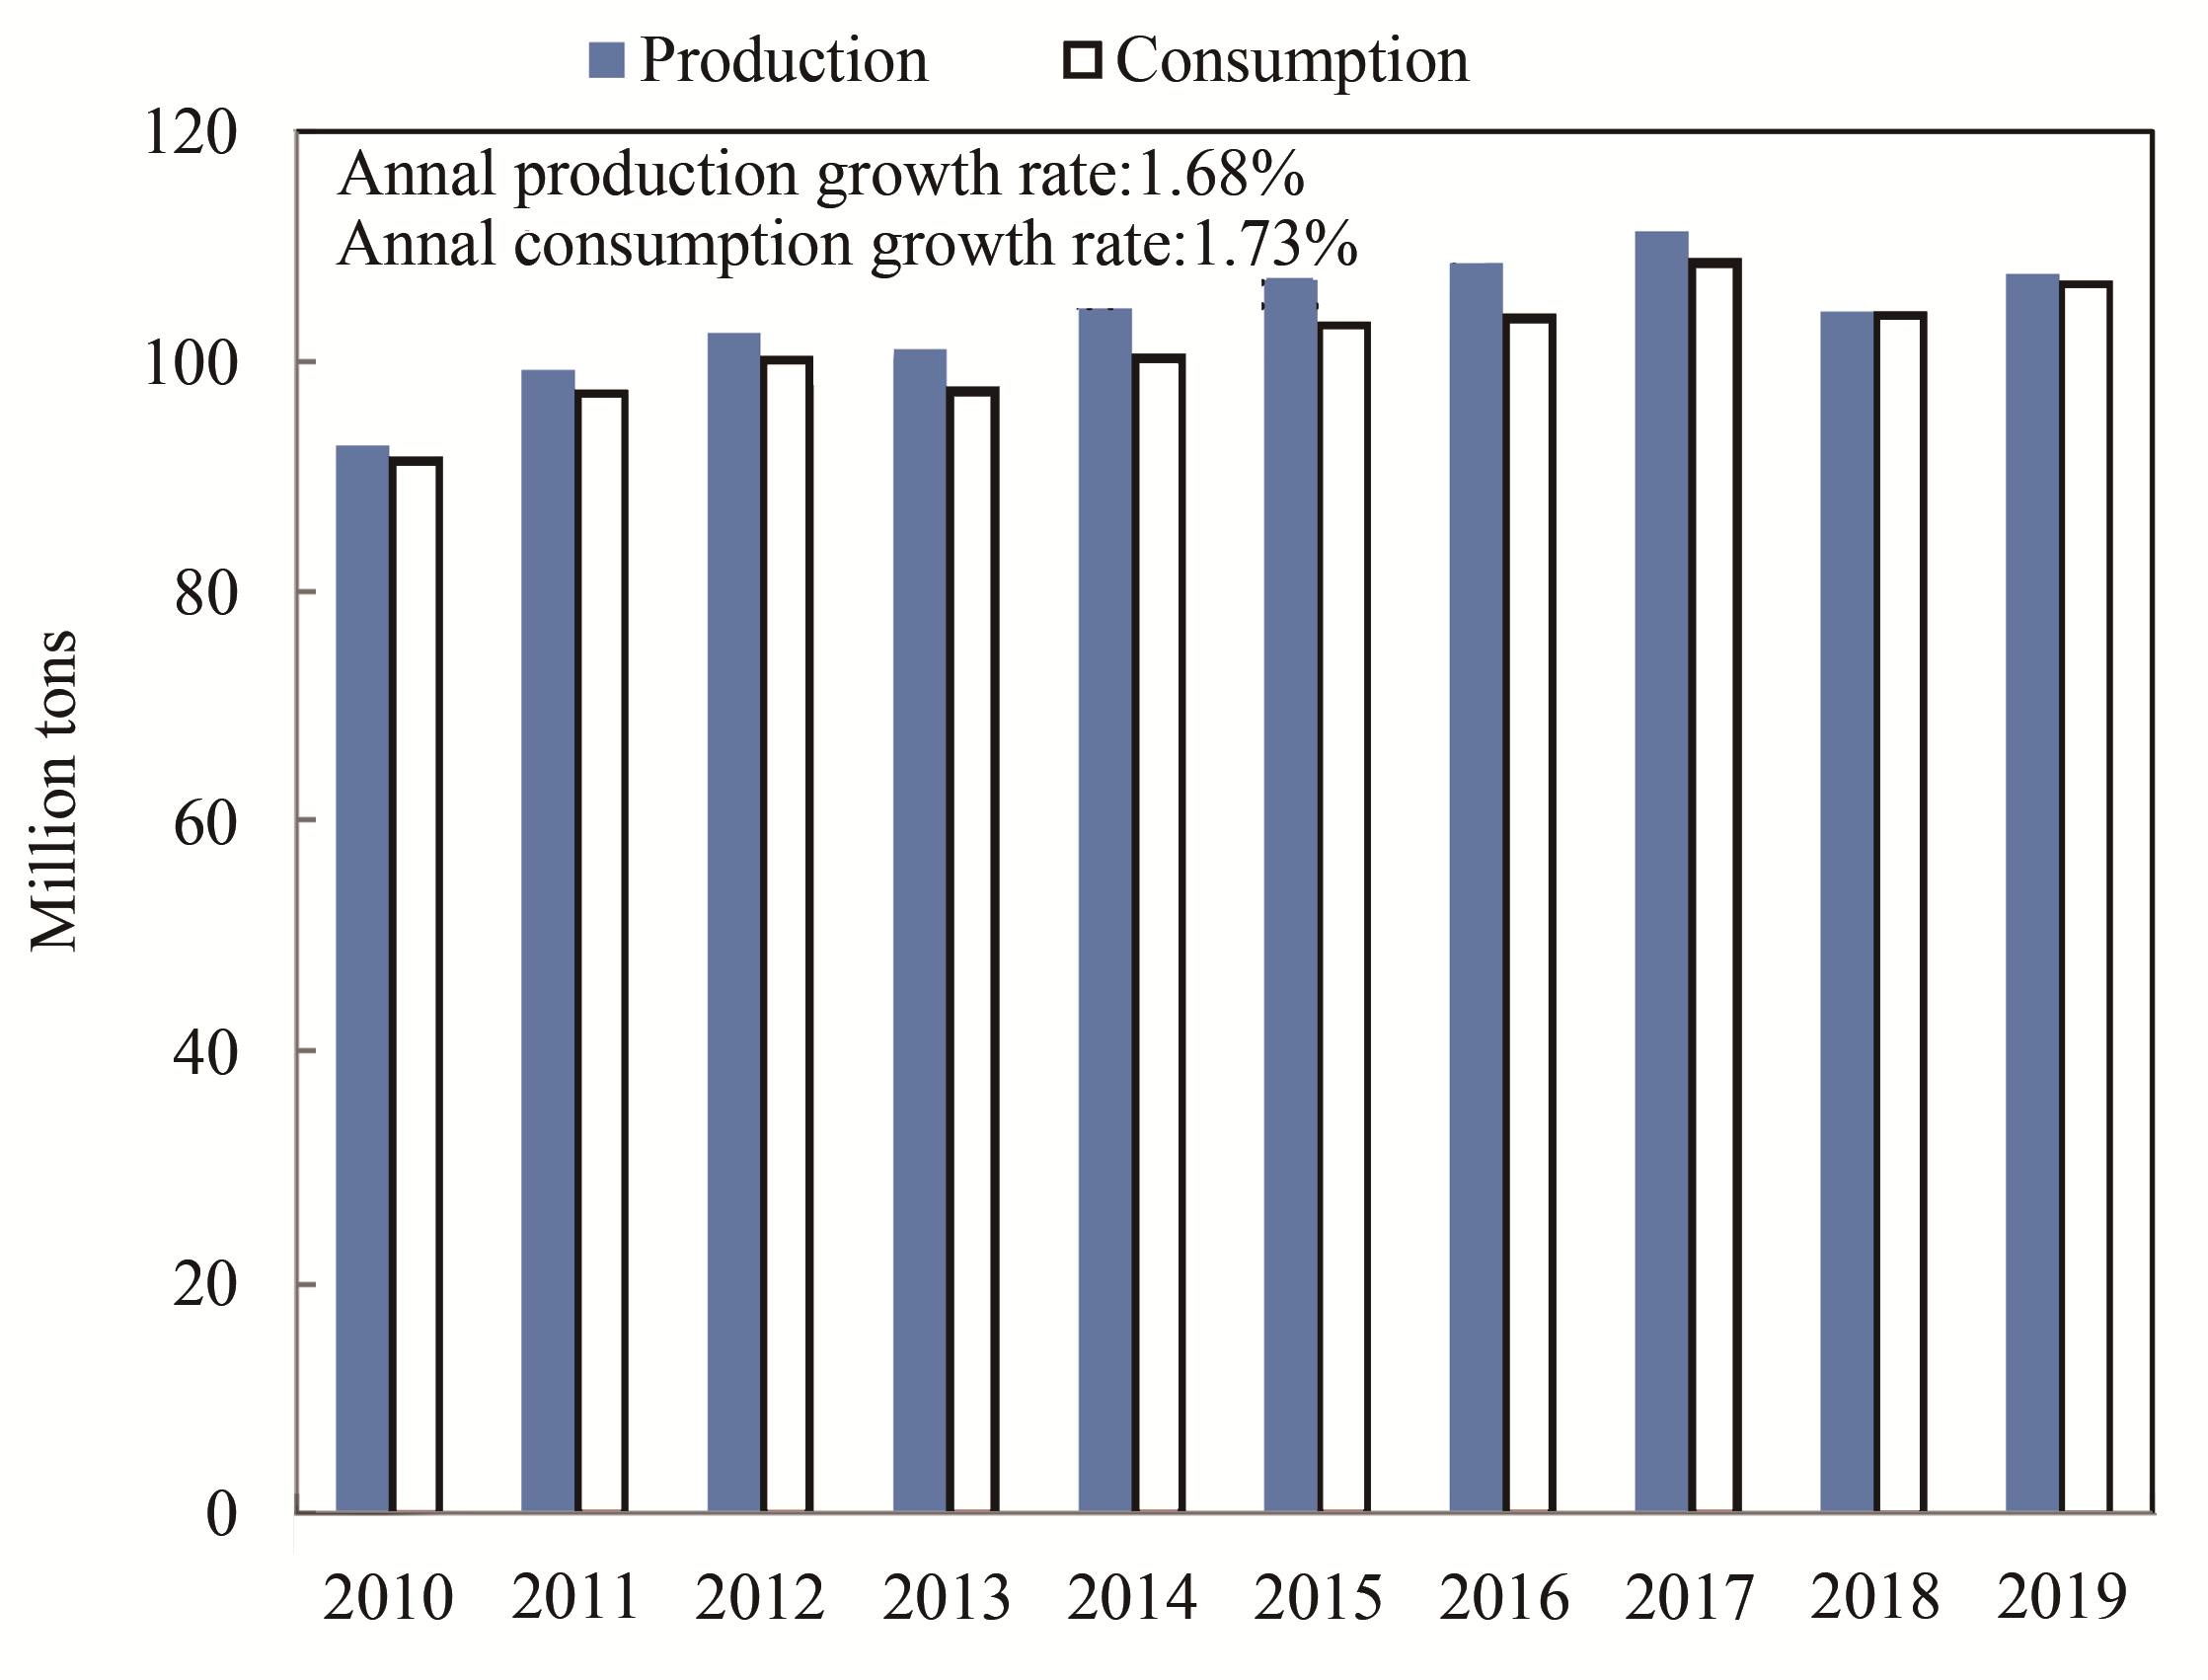
Fig. 1 Total production and consumption of paper & board (2010-2019)
Shares of production and consumption of main paper & board grades in the nation’s gross in 2019 are shown in

Fig. 2 Production shares of main paper & board grades in 2019
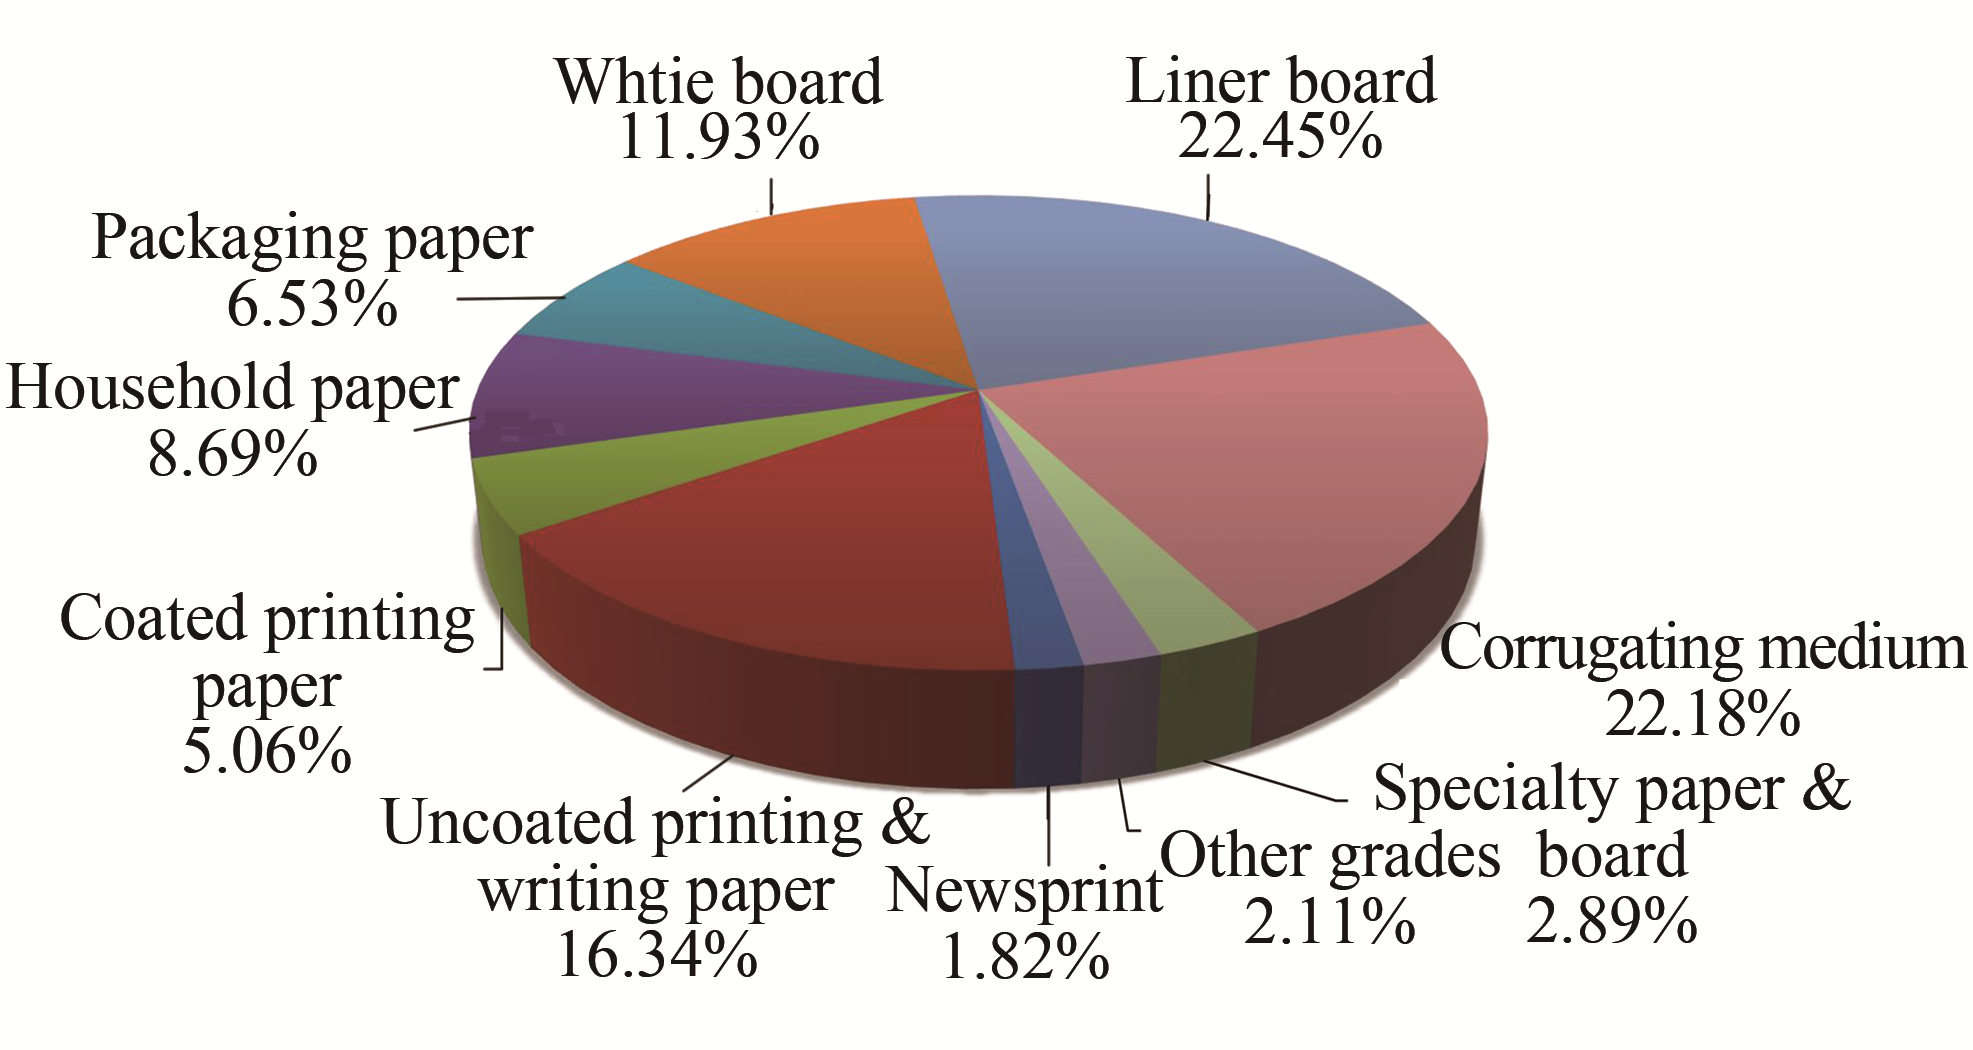
Fig. 3 Consumption shares of main paper & board grades in 2019
In 2019, the production and consumption of newsprint were 1.50 million tons and 1.95 million tons, decreased by 21.05% and 17.72% compared with 2018, respectively. The average annual growth rates of production and consumption from 2010 to 2019 were -11.04% and -8.24%, respectively, as shown in
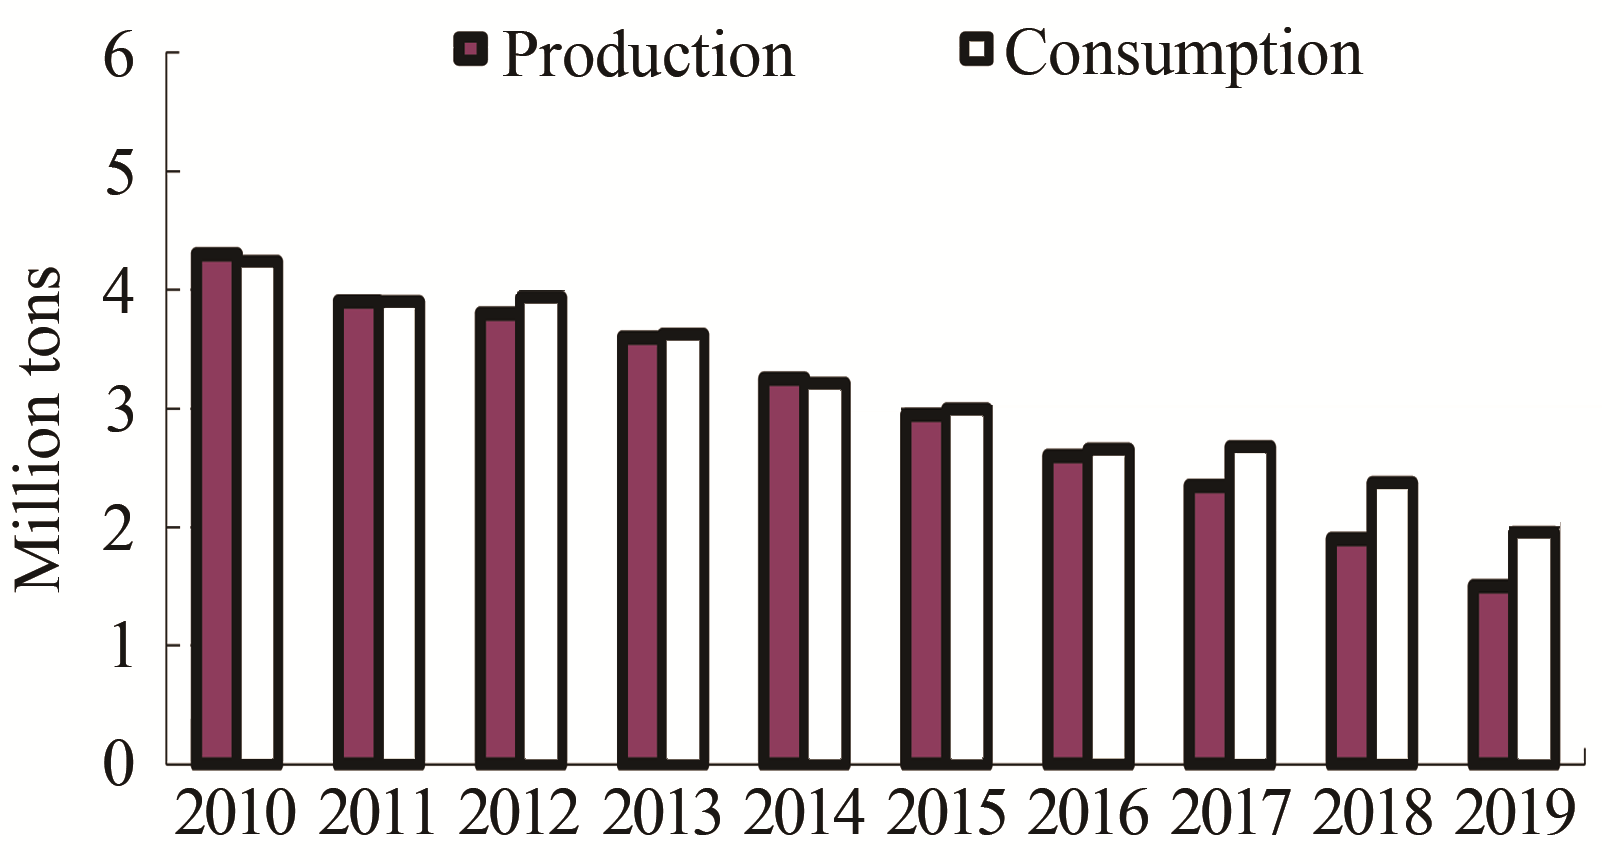
Fig. 4 Production and consumption of newsprint (2010-2019)
In 2019, the production and consumption of uncoated printing & writing paper were 17.80 million tons and 17.49 million tons, increased by 1.71% and decreased by 0.11% compared with 2018, respectively. The average annual growth rates of production and consumption from 2010 to 2019 were 1.05% and 1.06%, respectively, as shown in
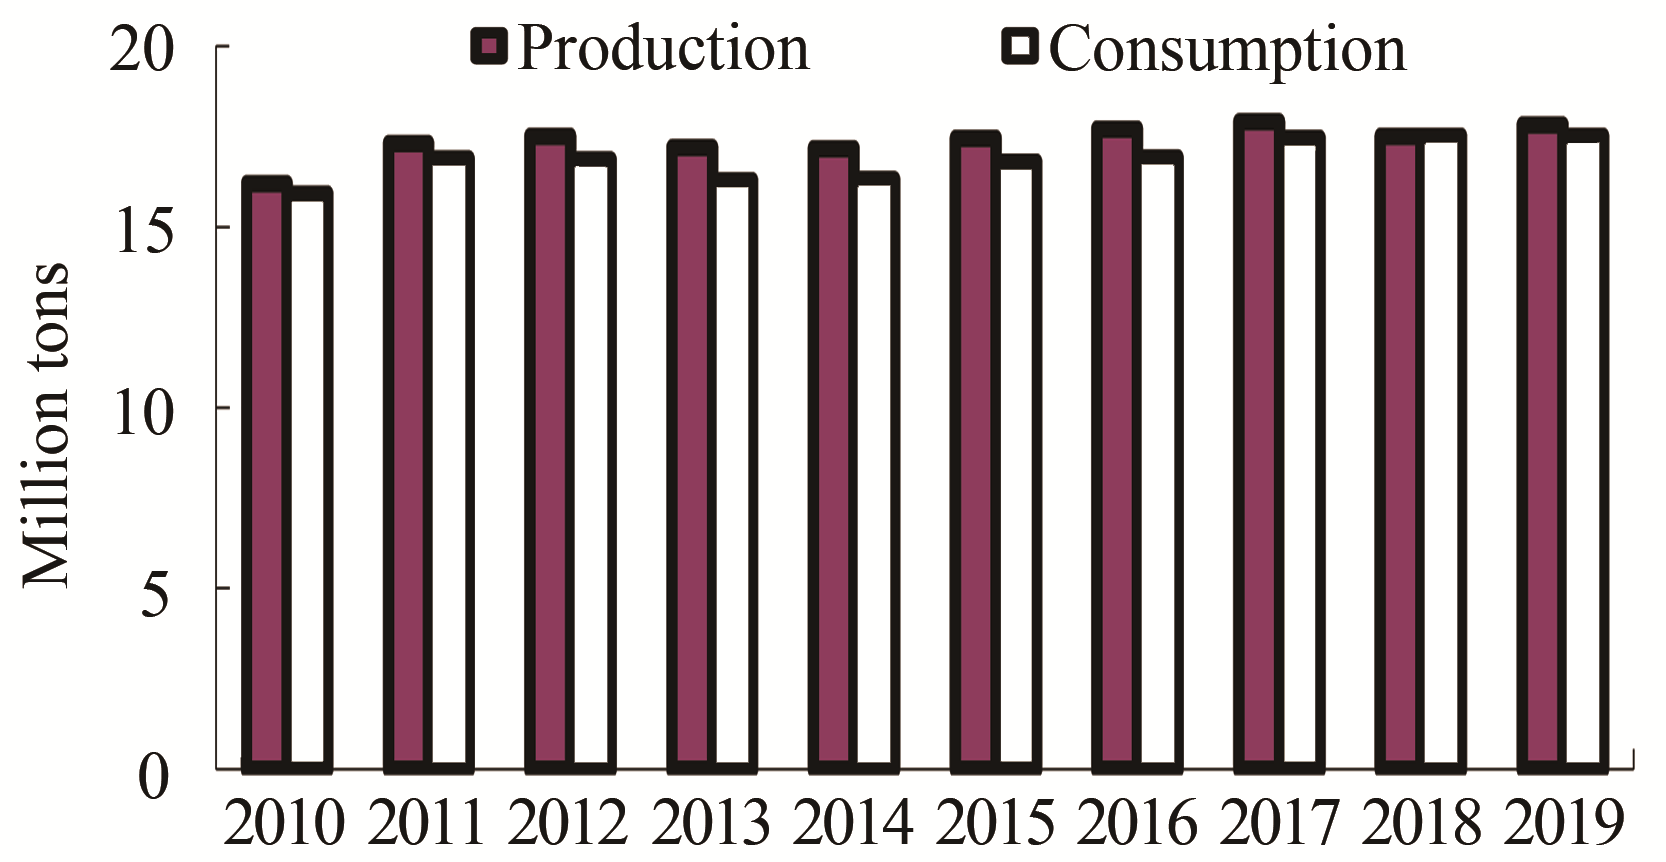
Fig. 5 Production and consumption of uncoated printing & writing paper (2010-2019)
In 2019, the production and consumption of coated printing paper were 6.80 million tons and 5.42 million tons, decreased by 3.55% and 10.26% compared with 2018, respectively. The average annual growth rates of production and consumption from 2010 to 2019 were 0.68% and -0.14%, respectively, as shown in
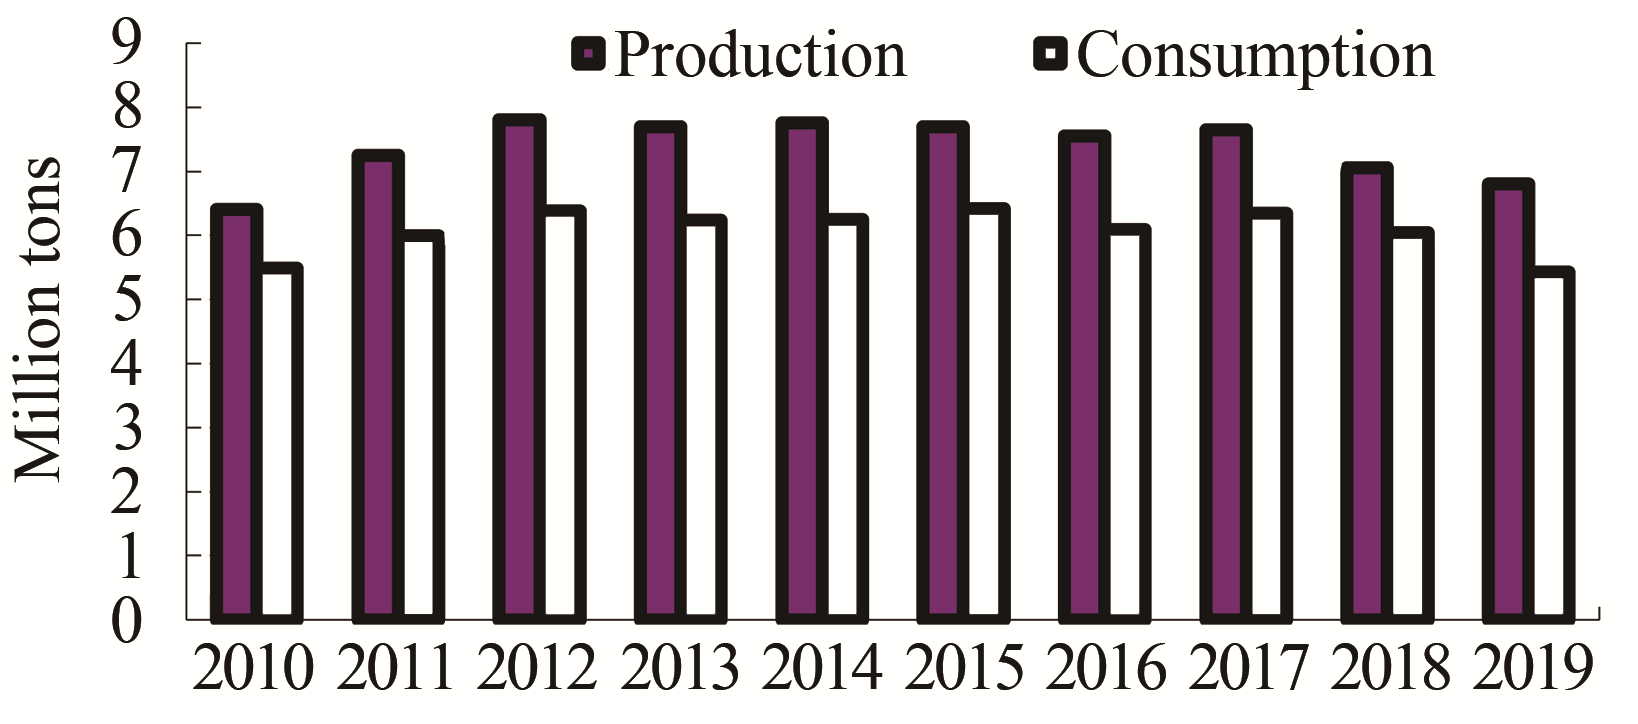
Fig. 6 Production and consumption of coated printing paper (2010-2019)
In which, the production and consumption of coated art paper were 6.30 million tons and 5.35 million tons in 2019, decreased by 3.82% and 7.92% compared with 2018, respectvely. The average annual growth rates of production and consumption from 2010 to 2019 were 1.42% and 1.21%, respectvely, as shown in
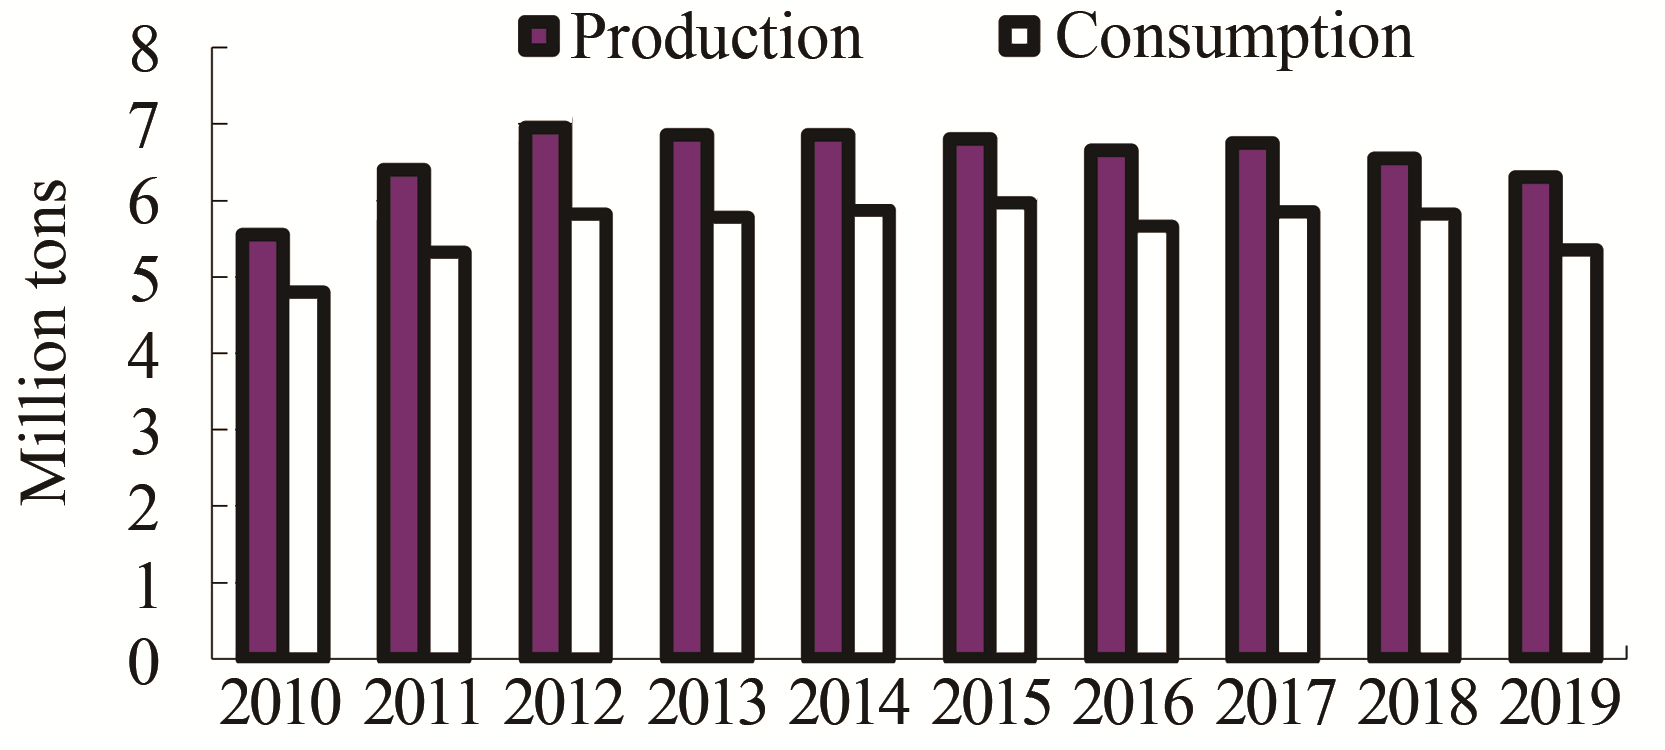
Fig. 7 Production and consumption of coated art paper (2010-2019)
In 2019, the production and consumption of household paper were 10.05 million tons and 9.30 million tons, increased by 3.61% and 3.22% compared with 2018, respectively. The average annual growth rates of production and consumption from 2010 to 2019 were 5.51% and 5.65%, respectively, as shown in
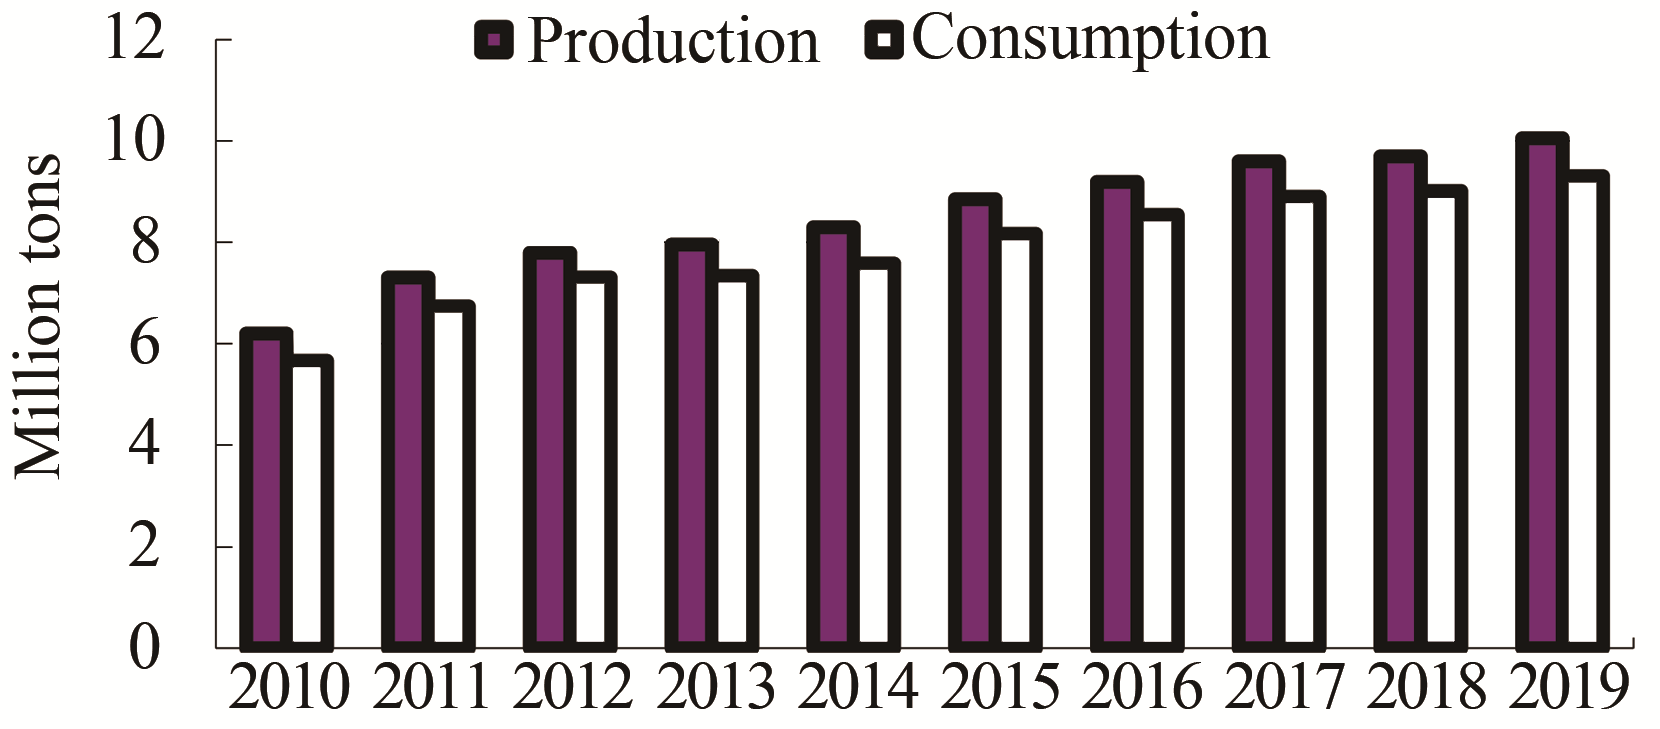
Fig. 8 Production and consumption of household paper (2010-2019)
In 2019, the production and consumption of packaging paper were 6.95 million tons and 6.99 million tons, increased by 0.72% and decreased by 0.29% compared with 2018, respectively. The average annual growth rates of production and consumption from 2010 to 2019 were 1.65% and 1.49%, respectively, as shown in
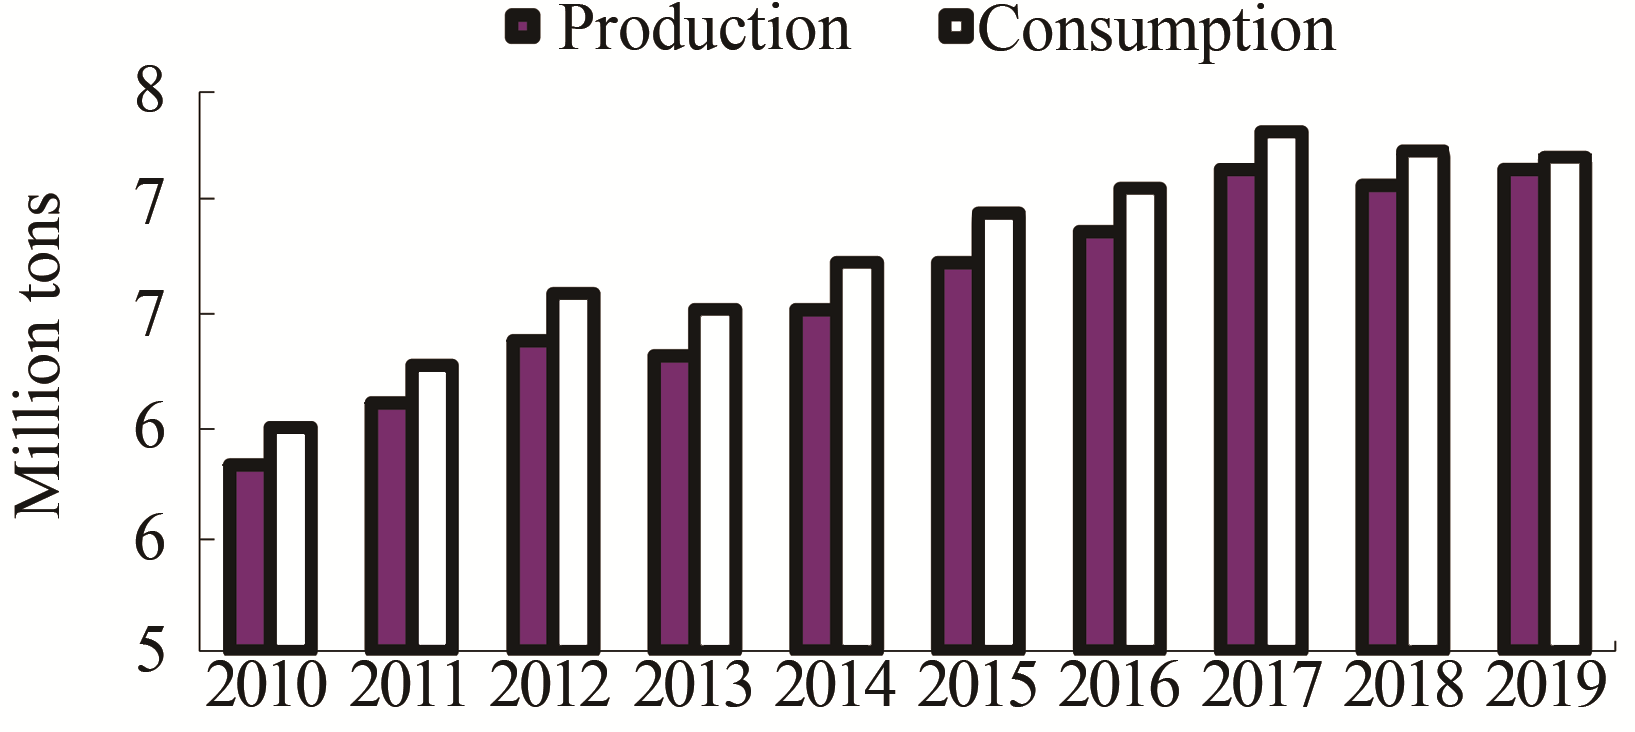
Fig. 9 Production and consumption of packaging paper (2010-2019)
In 2019, the production and consumption of white board were 14.10 million tons and 12.77 million tons, increased by 5.62% and 4.76% compared with 2018, respectively. The average annual growth rates of production and consumption from 2010 to 2019 were 1.35% and 0.20%, respectively, as shown in
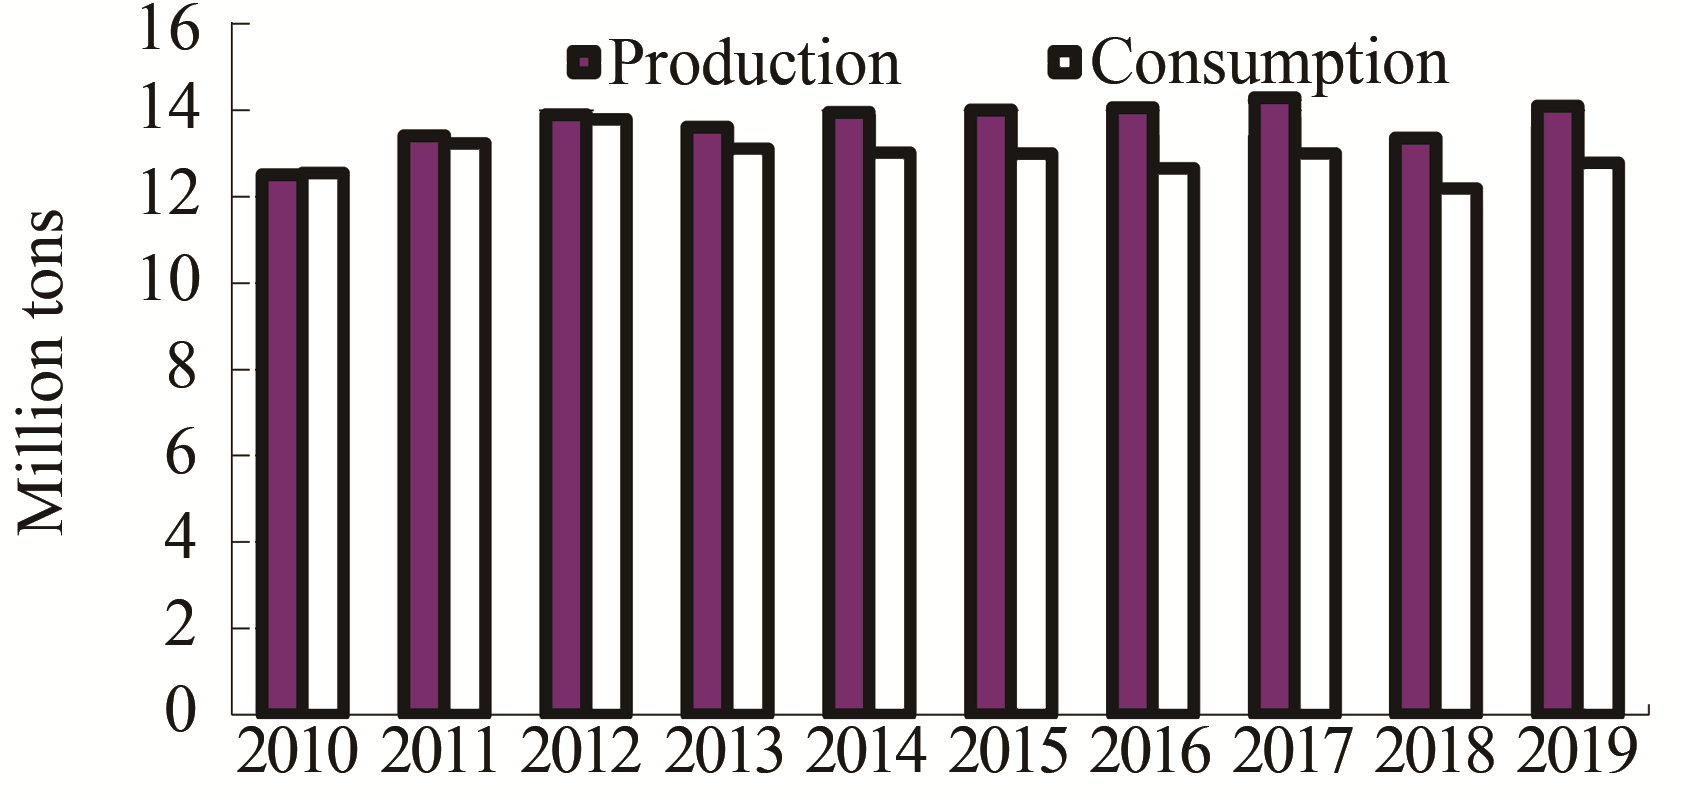
Fig. 10 Production and consumption of white board (2010-2019)
In which, the production and consumption of coated white board were 13.50 million tons and 12.16 million tons, increased by 5.88% and 5.01% compared with 2018, respectively. The average annual growth rates of production and consumption from 2010 to 2019 were 1.32% and 0.11%, respectively, as shown in
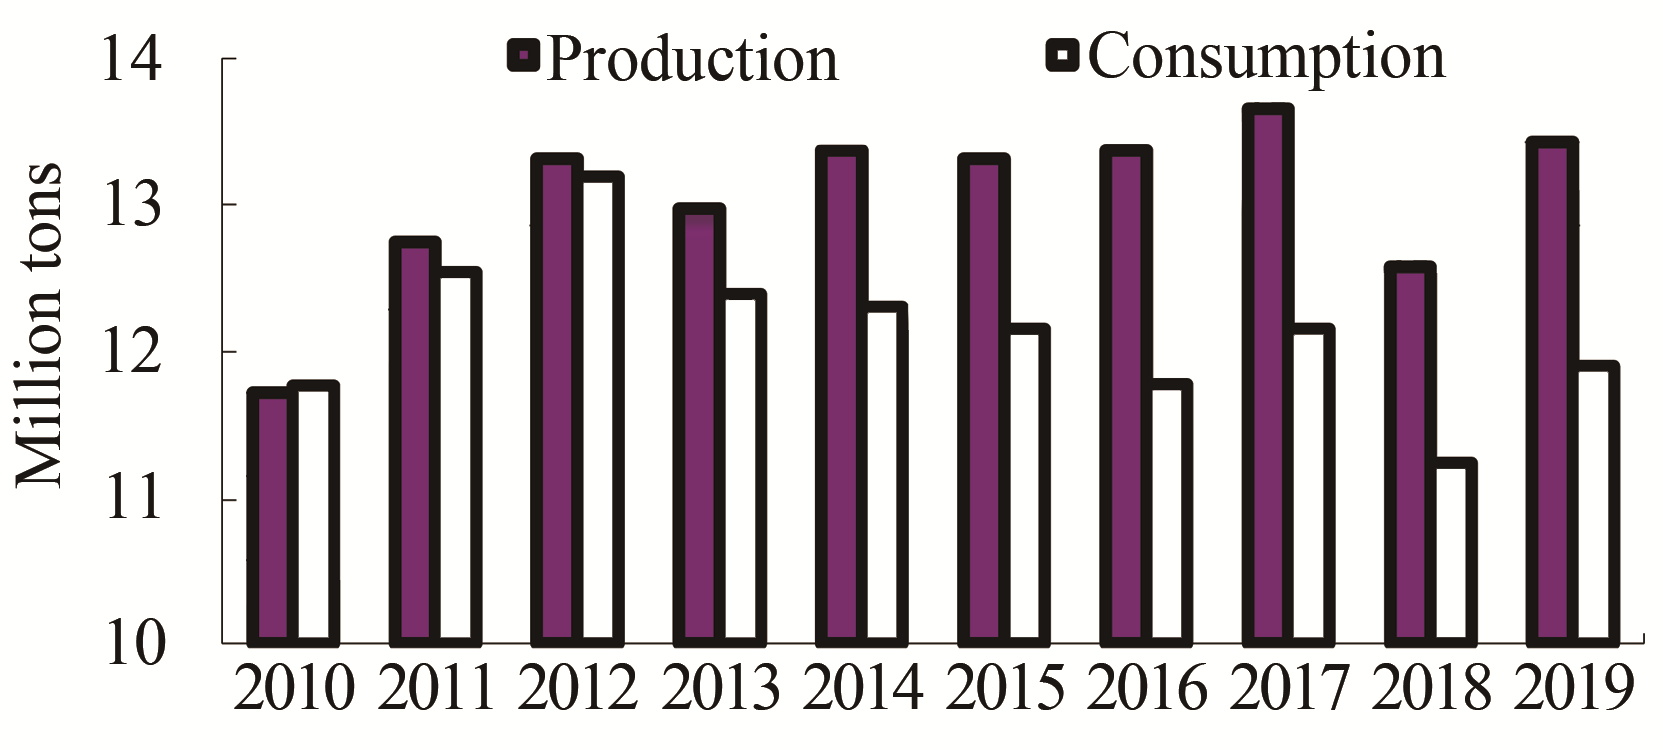
Fig. 11 Production and consumption of coated white board (2010-2019)
In 2019, the production and consumption of liner board were 21.90 million tons and 24.03 million tons, increased by 2.10% and 2.47% compared with 2018, respectively. The average annual growth rates of production and consumption from 2010 to 2019 were 1.71% and 2.37%, respectively, as shown in
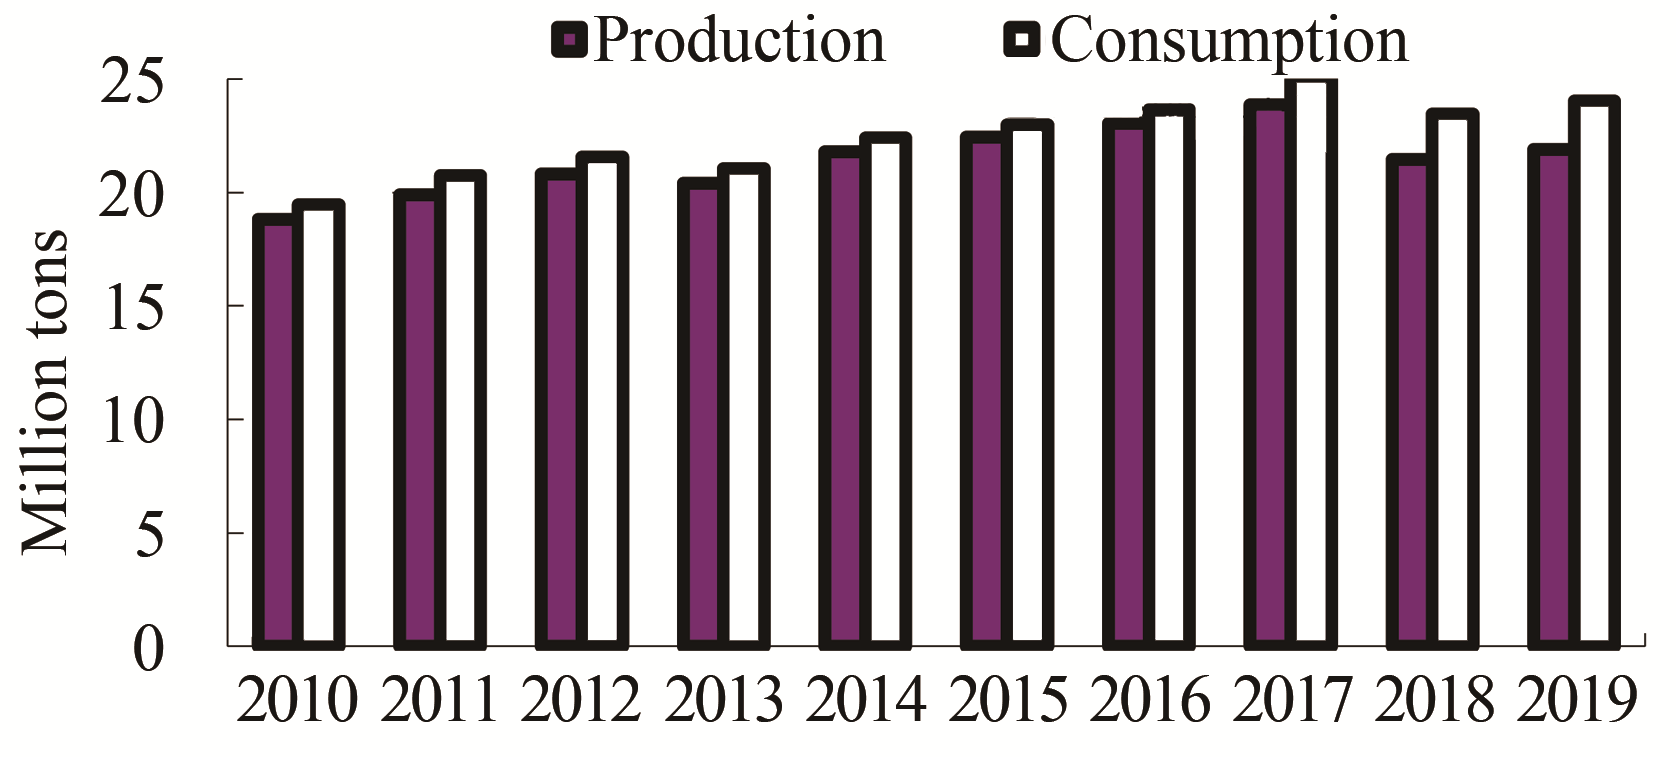
Fig. 12 Production and consumption of liner board (2010-2019)
In 2019, the production and consumption of corrugating medium were 22.20 million tons and 23.74 million tons, increased by 5.46% and 7.28% compared with 2018, respectively. The average annual growth rates of production and consumption from 2010 to 2019 were 1.92% and 2.57%, respectively, as shown in
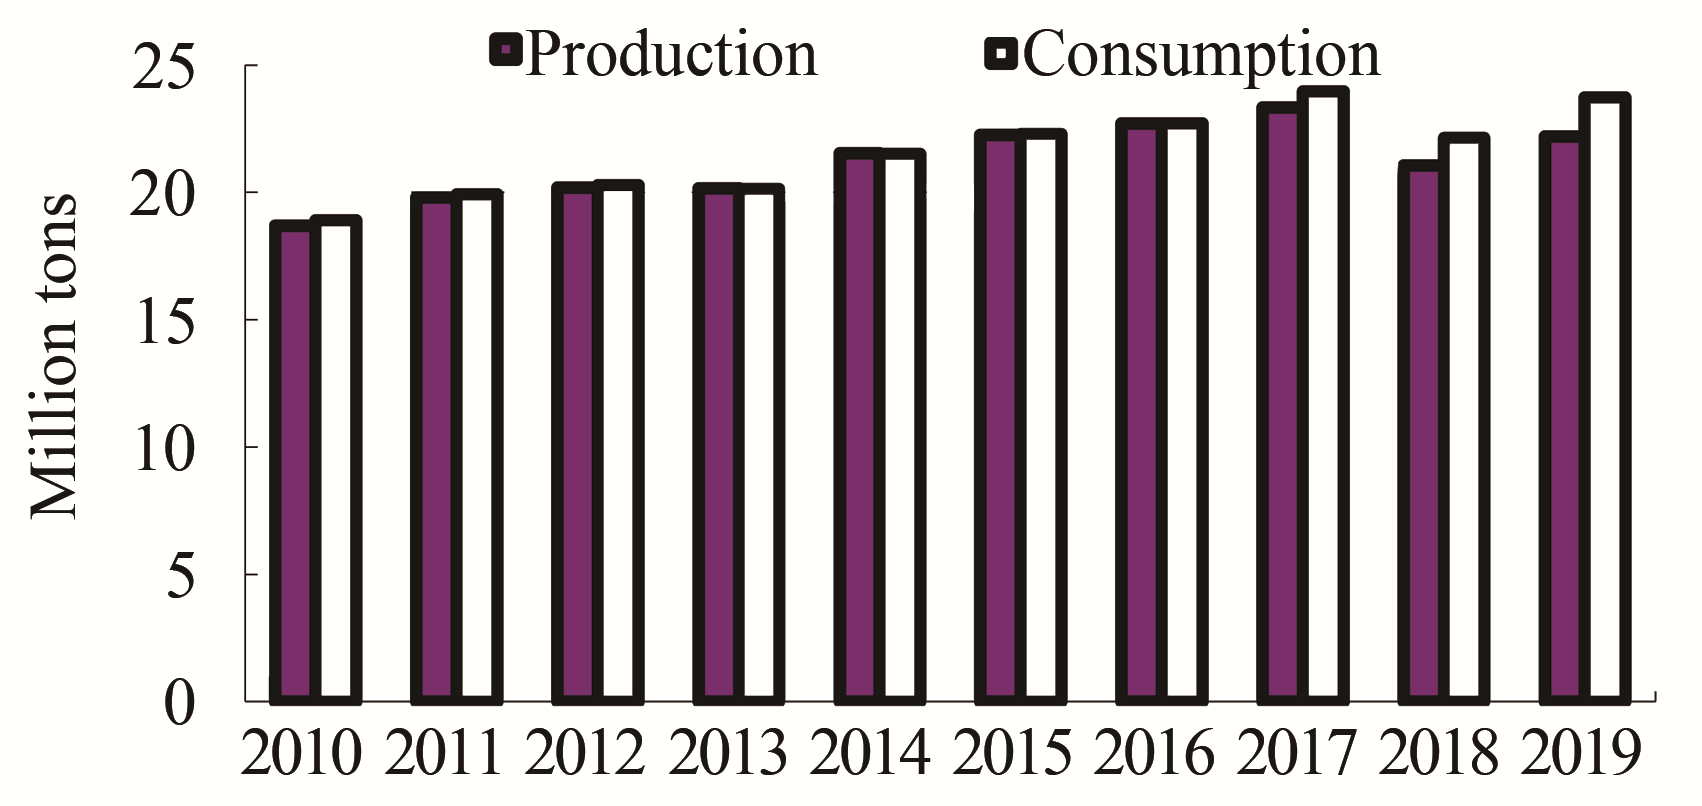
Fig. 13 Production and consumption of corrugating medium (2010-2019)
In 2019, the production and consumption of specialty paper & board were 3.80 million tons and 3.09 million tons, increased by 18.75% and 18.39% compared with 2018, respectively. The average annual growth rates of production and consumption from 2010 to 2019 were 8.66% and 7.29%, respectively, as shown in
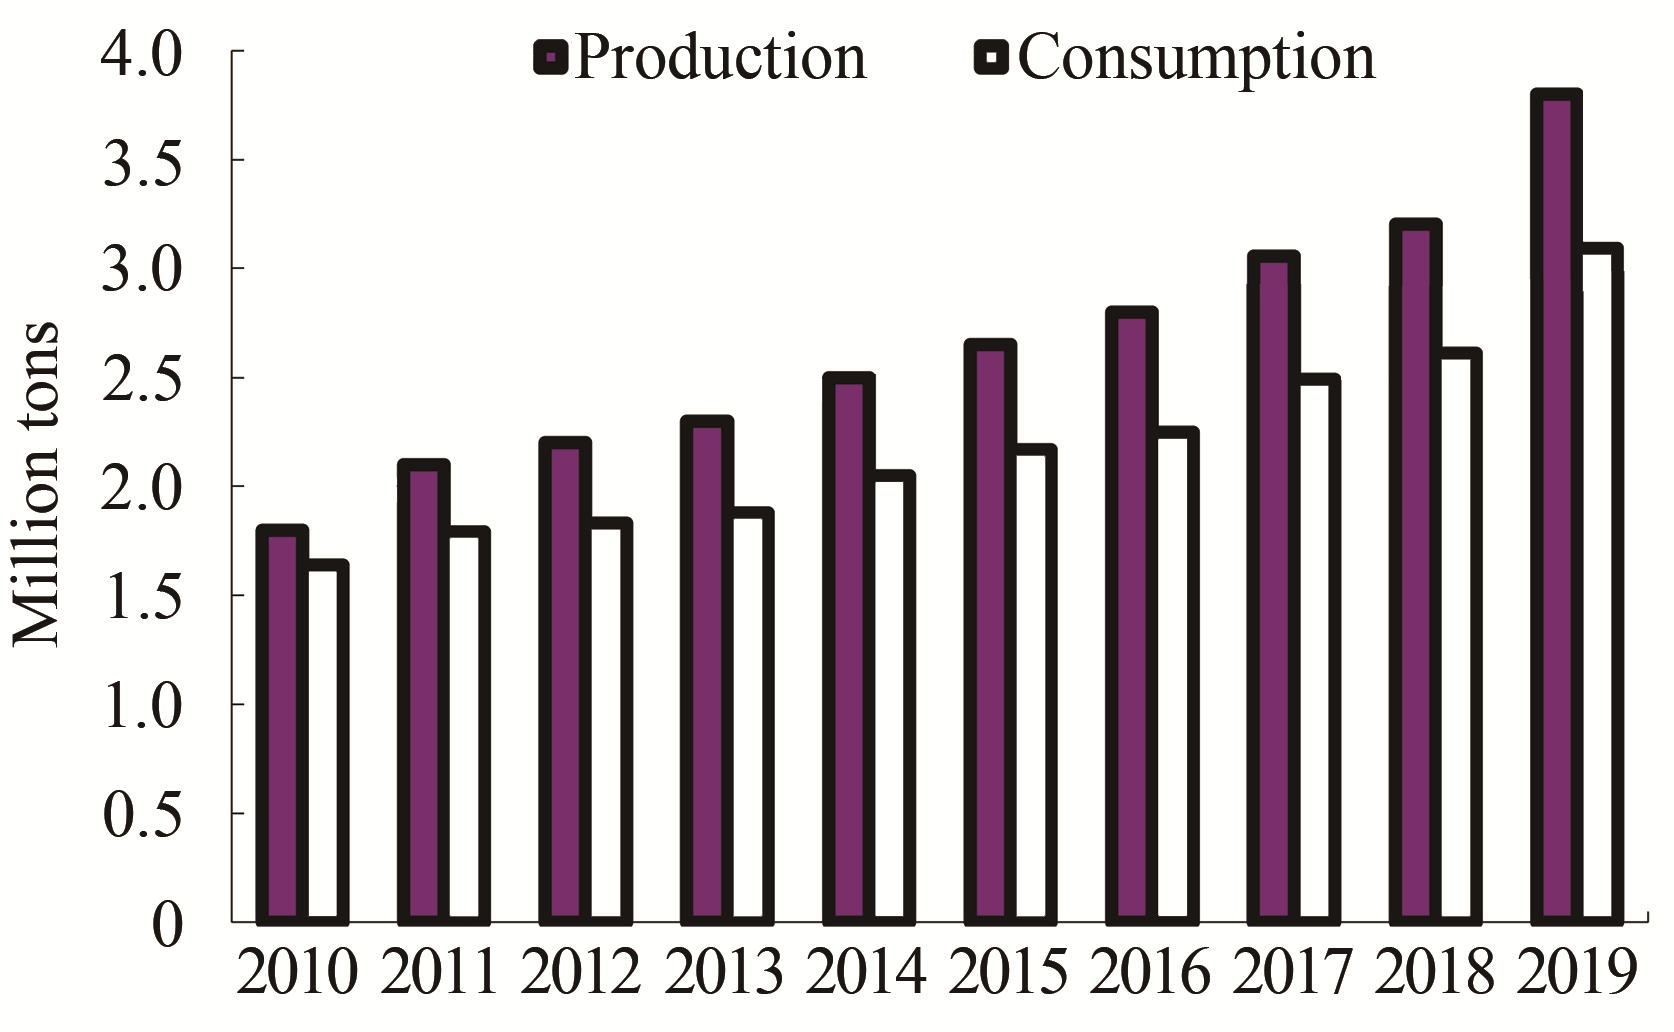
Fig. 14 Production and consumption of specialty paper & board (2010-2019)
According to the statistics released by the National Bureau of Statistics, in 2019, there were 2524 paper and board producers whose scales were above the statistical threshold. Their core business income was RMB 765.0 billion. The growth rate of industrial added value was 4.80%. The products inventory was RMB 30.3 billion, decreased by 18.88% compared with 2018. The total pre-tax profits was RMB 35.9 billion, decreased by 21.06% compared with 2018. The total asset was RMB 1048.9 billion, increased by 1.78% compared with 2018. The asset-liability ratio was 59.59%. The total liability was RMB 625.0 billion, increased by 2.16% compared with 2018. 560 producers accounting for 22.19% of total 2524 paper and board producers were running with deficit.
The major economic indicators from 2010 to 2019 are shown in
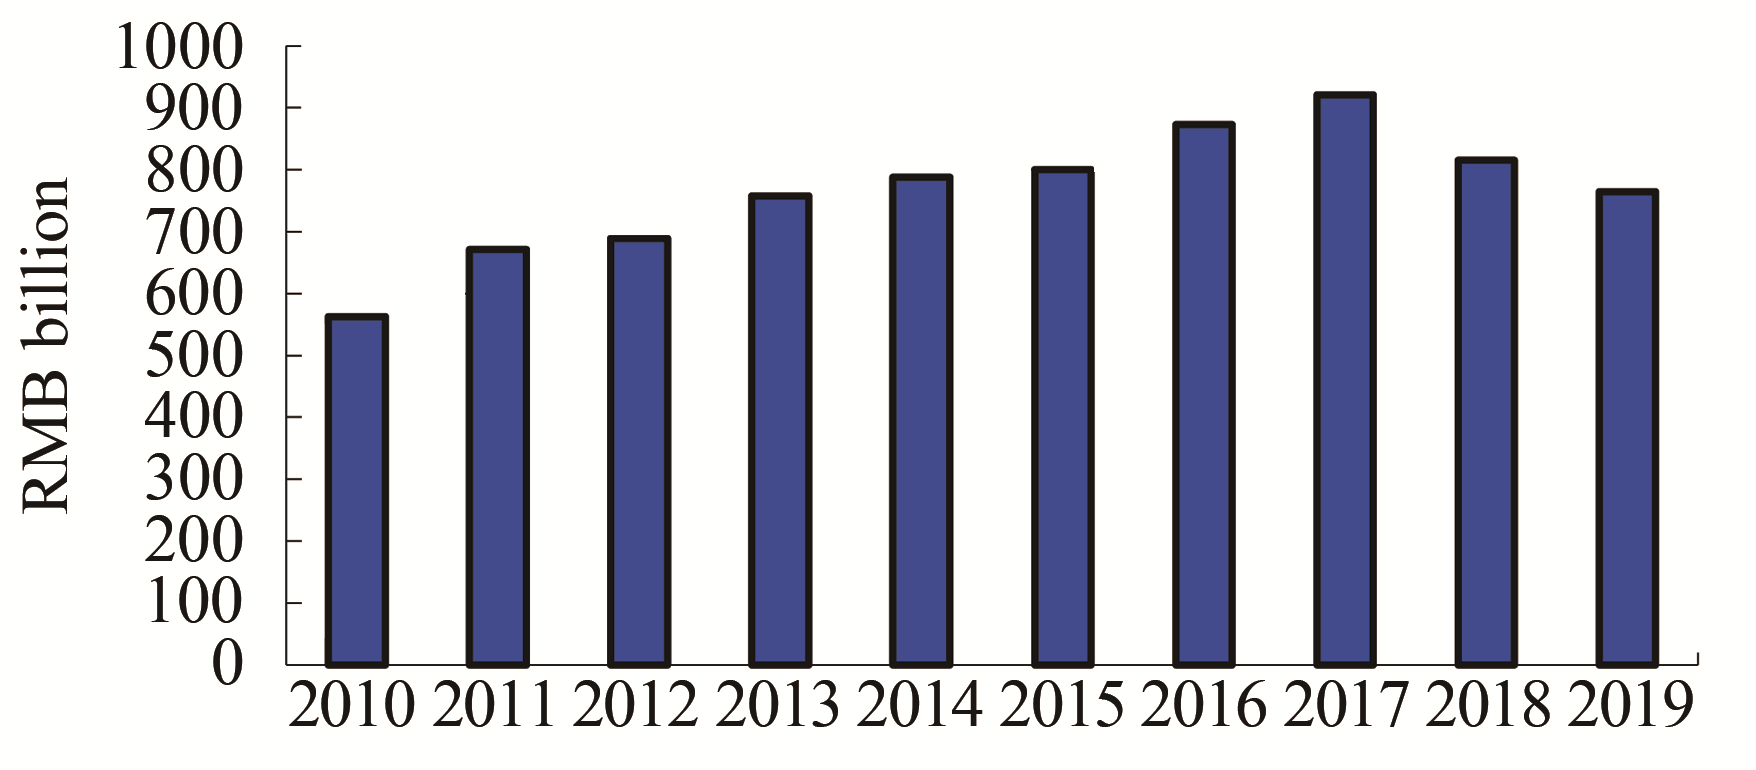
Fig. 15 Core bussiness income (2010-2019)
The data of 2010 were from CPA.
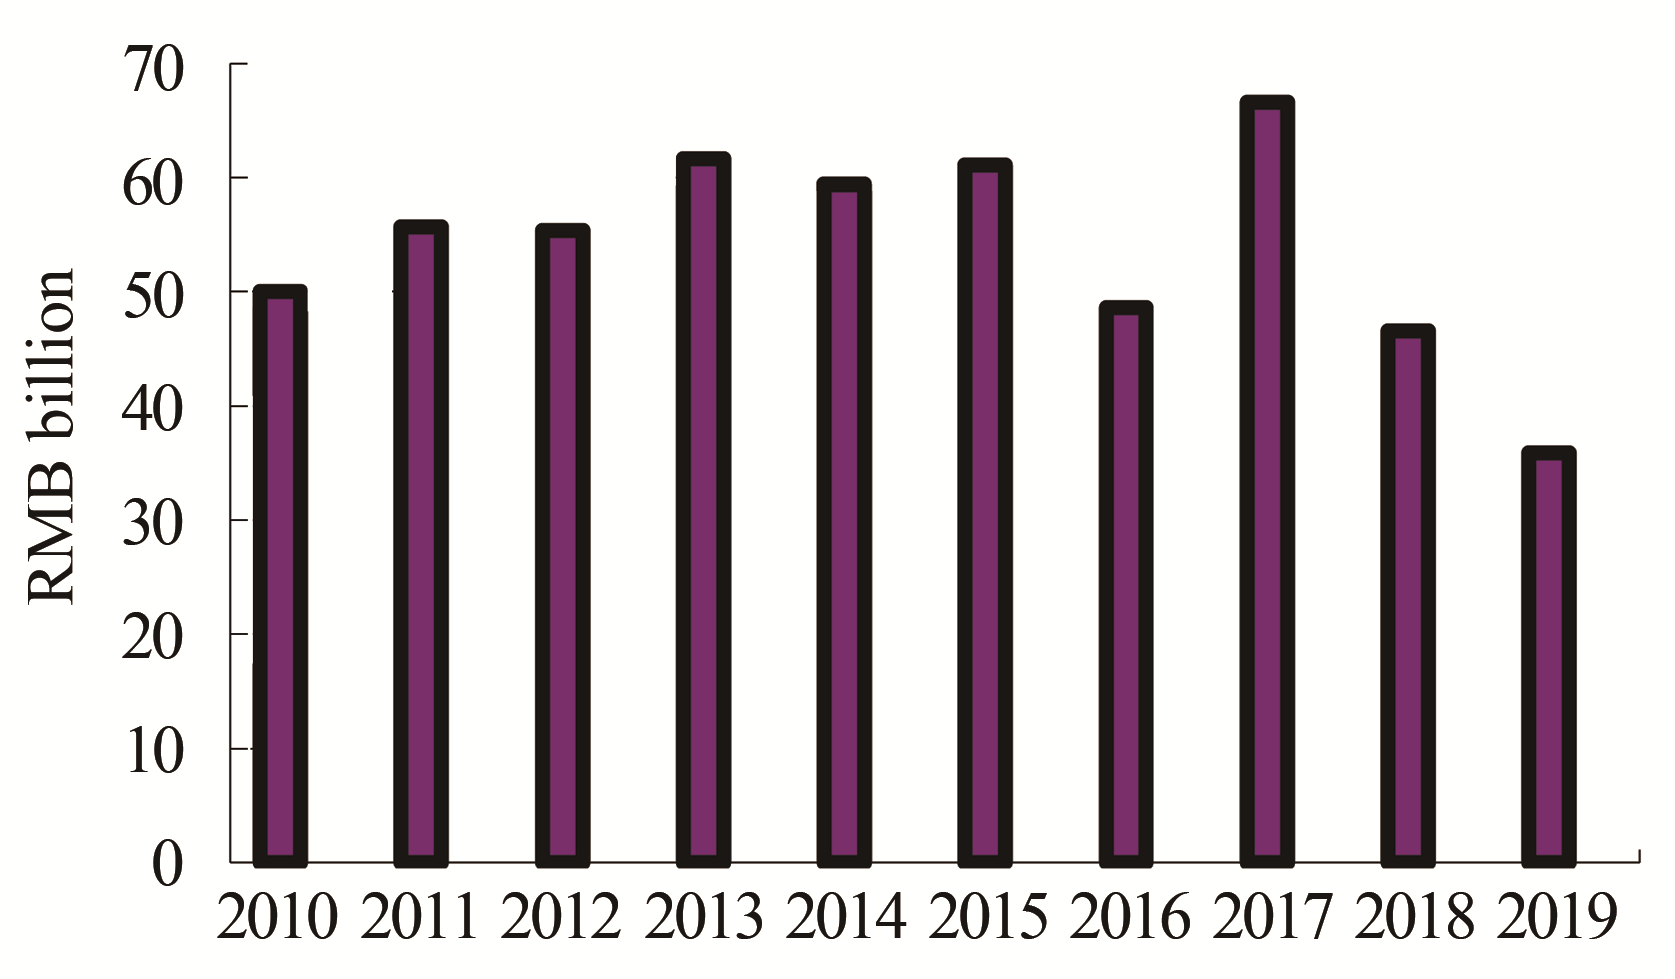
Fig. 16 Total pre-tax profits (2010-2019)
The data of 2010 were from CPA.
According to CPA’s survey, the total pulp production was 72.07 million tons in 2019, increased by 0.08% compared with 2018. In which, wood pulp was 12.68 million tons, increased by 10.55%; pulp from waste paper was 53.51 million tons, decreased by 1.71%; non-wood pulp was 5.88 million tons, decreased by 3.61% compared with 2018, as shown in
In 2019, the total pulp consumption was 96.09 million tons, increased by 2.36% compared with 2018. The consumption of wood pulp was 35.81 million tons, and its share in total pulp consumption was 37%, in which, imported wood pulp accounted for 24%, domestic wood pulp accounted for 13%. The consumption of pulp from wastepaper was 54.43 million tons, and its share in total pulp consumption was 57%; in which, the pulps from imported and domestic waste paper accounted for 10% and 46%, respectively. Consumption of non-wood pulp was 5.85 million tons, and its share in total pulp consumption was 6%, as shown in
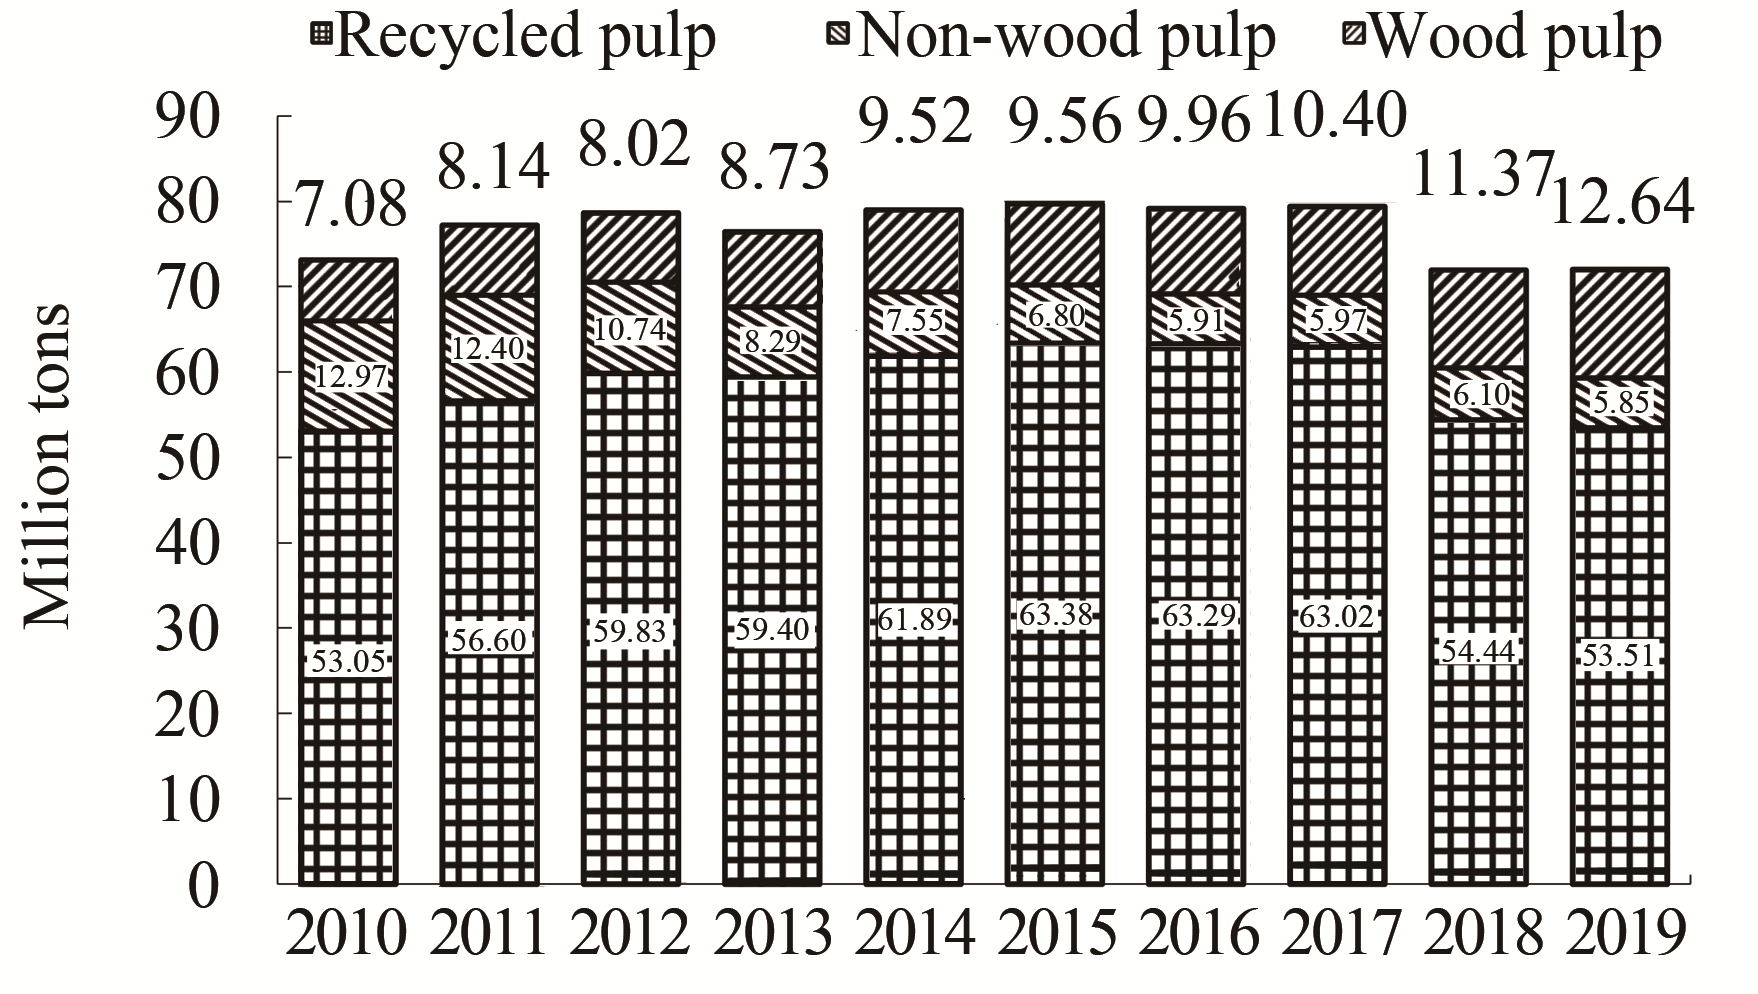
Fig.17 Consumption of domestic pulp (2010-2019)
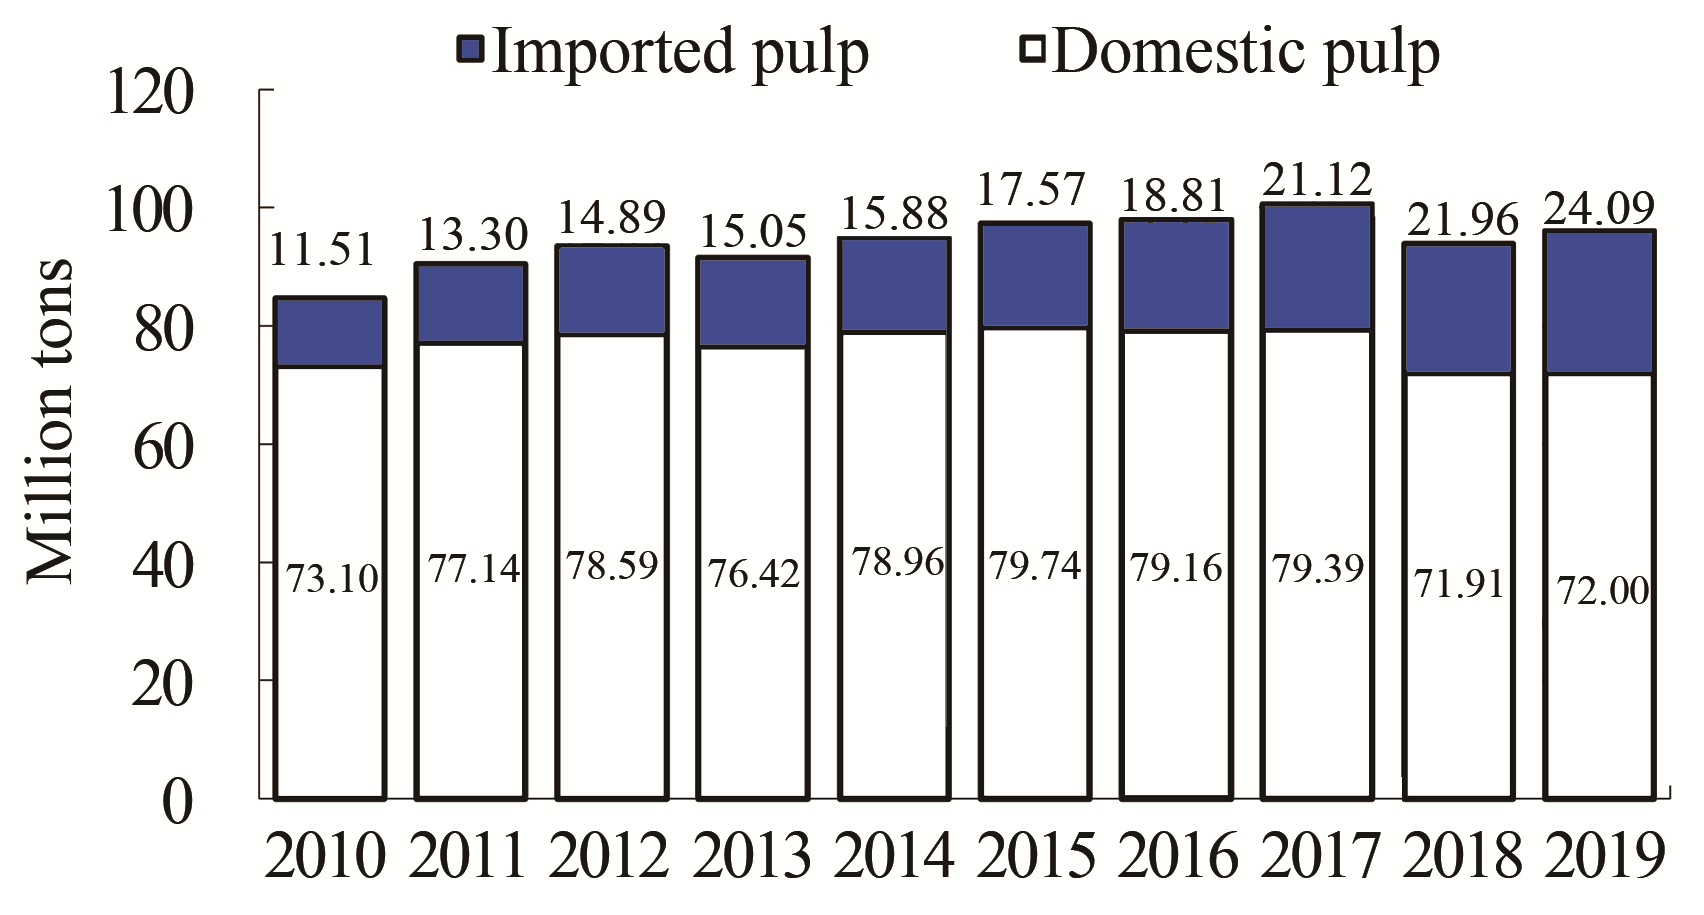
Fig.18 Total consumption of pulp (2010-2019)
In 2019, the total amount of waste paper recovered in domestic was 52.44 million tons, increased by 5.64%, the recovery rate of waste paper was 49.0%, the utilization rate of waste paper was 58.3%, and the average annual growth rates of the total amount of waste paper recovered was 3.01%, as shown in
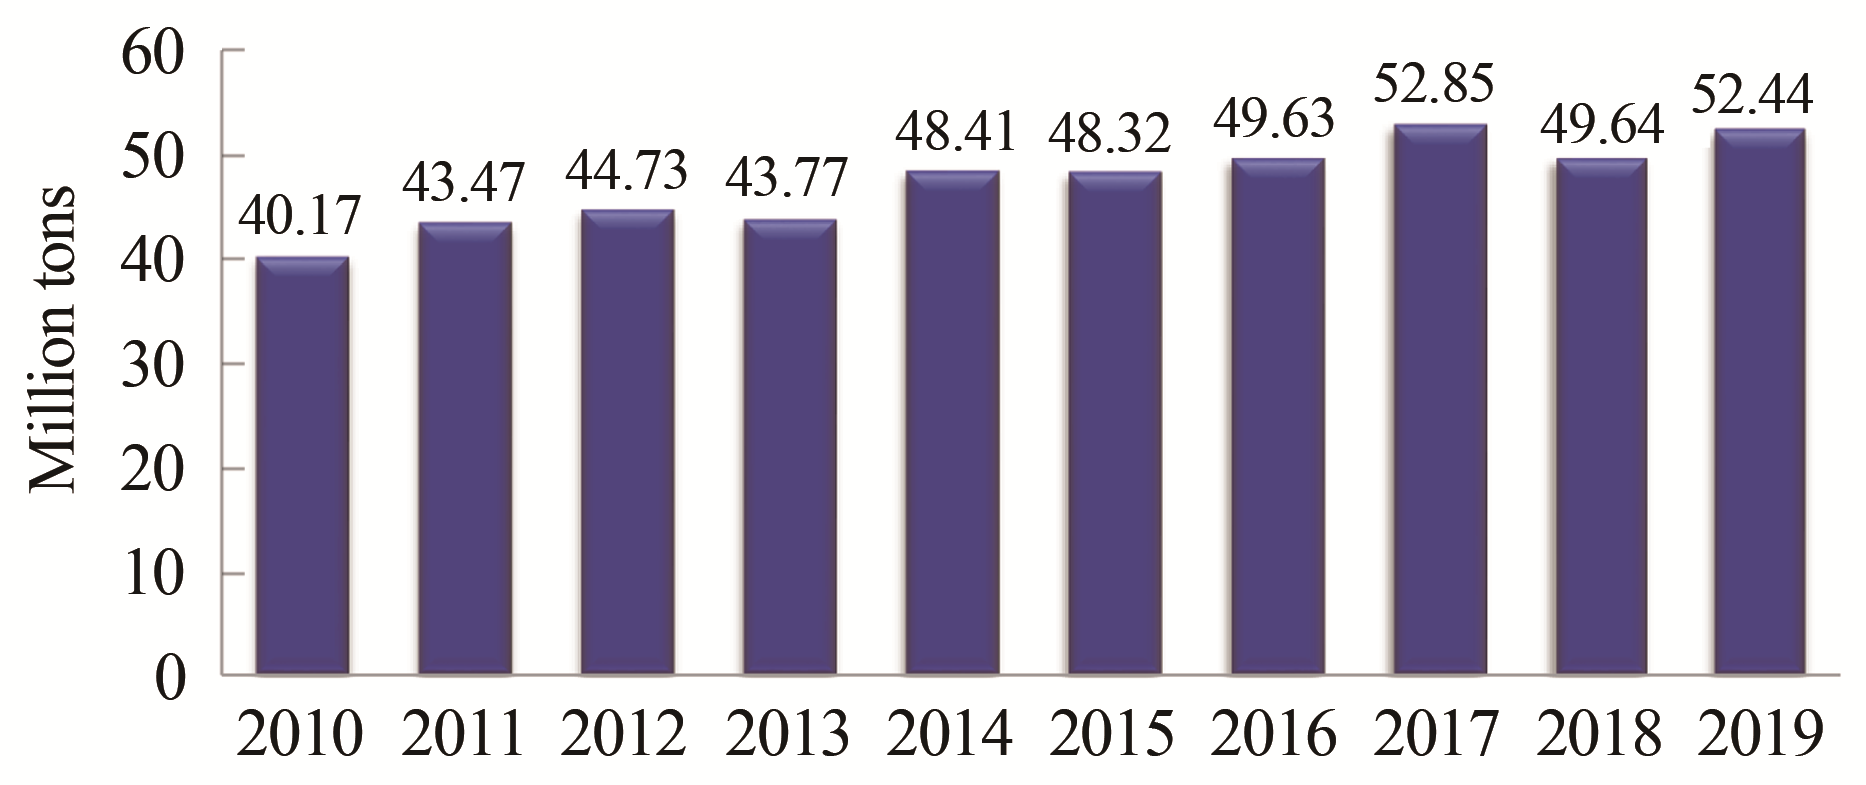
Fig. 19 The total amount of waste paper collected national wide (2010-2019)
According to the statistics from National Bureau of Statistics, there were 4119 paper products enterprises in 2019, and the production was 72.19 million tons, increased by 29.42% compared with 2018; the consumption was 68.86 million tons, increased by 30.59% compared with 2018; the import amount was 120000 tons and the export amount was 3.45 million tons. The average annual growth rates of production and consumption from 2010 to 2019 were 4.53% and 4.49%, respectively, as shown in
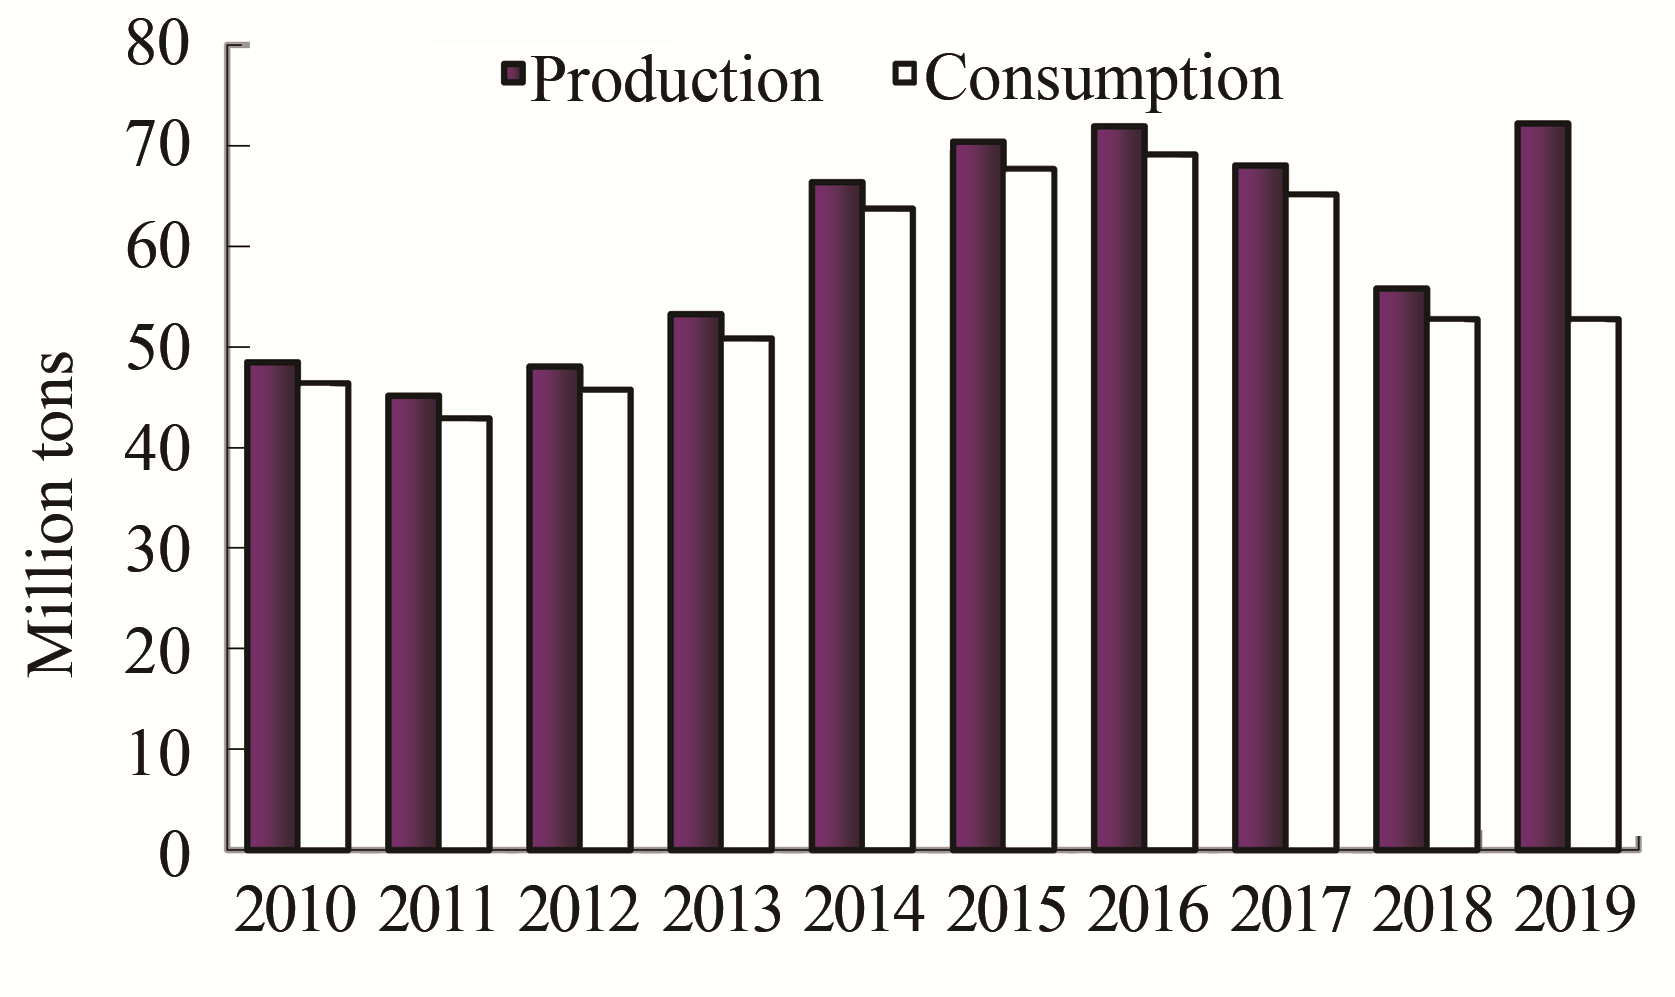
Fig. 20 Production and consumption of paper products (2010-2019)
The data were from National Bureau of Statistics of the People's Republic of China.
In 2019, the import amount of paper & board was 6.25 million tons, increased by 0.48% compared with 2018. The import amount of pulp was 27.20 million tons, increased by 9.72% compared with 2018. The import amount of waste paper was 10.36 million tons, decreased by 39.17% compared with 2018. The import amount of paper products was 120000 tons, decreased by 33.33%.
In 2019, the total import amount of paper & board, pulp, waste paper, paper products was 43.93 million tons, decreased by 8.90% compared with 2018; the total cost was USD 24.328 billion, decreased by 19.48% compared with 2018. The average price of imported paper & board was USD 750.51/t, decreased by 15.58% compared with 2018. The average price of imported pulp was USD 629.46/t, decreased by 20.85% compared with 2018. The average price of imported waste paper was USD 187.51/t, decreased by 25.60% compared with 2018, as shown in
*Data source: General Administration of Customs.
In 2019, the export amount of paper & board was 6.86 million tons and increased by 11.00% compared with 2018. The export amount of pulp was 116000 tons, increased by 16.12% compared with 2018. The export amount of waste paper was 800 tons, increased by 33.33% compared with 2018. The export amount of paper products was 3.45 million tons, increased by 6.81%.
In 2019, the total export amount of paper & board, pulp, waste Paper, paper products was 104.268 million tons, increased by 9.63%, their total earning was USD 22.003 billion, increased by 14.19% compared to 2018. The average price of exported paper & board was USD 1497.09/t, increased by 6.28%. The average price of exported pulp was USD 1151.20/t, decreased by 12.21%, as shown in
*Data source: General Administration of Customs.
The shares of imported and exported major paper & board grades are shown in
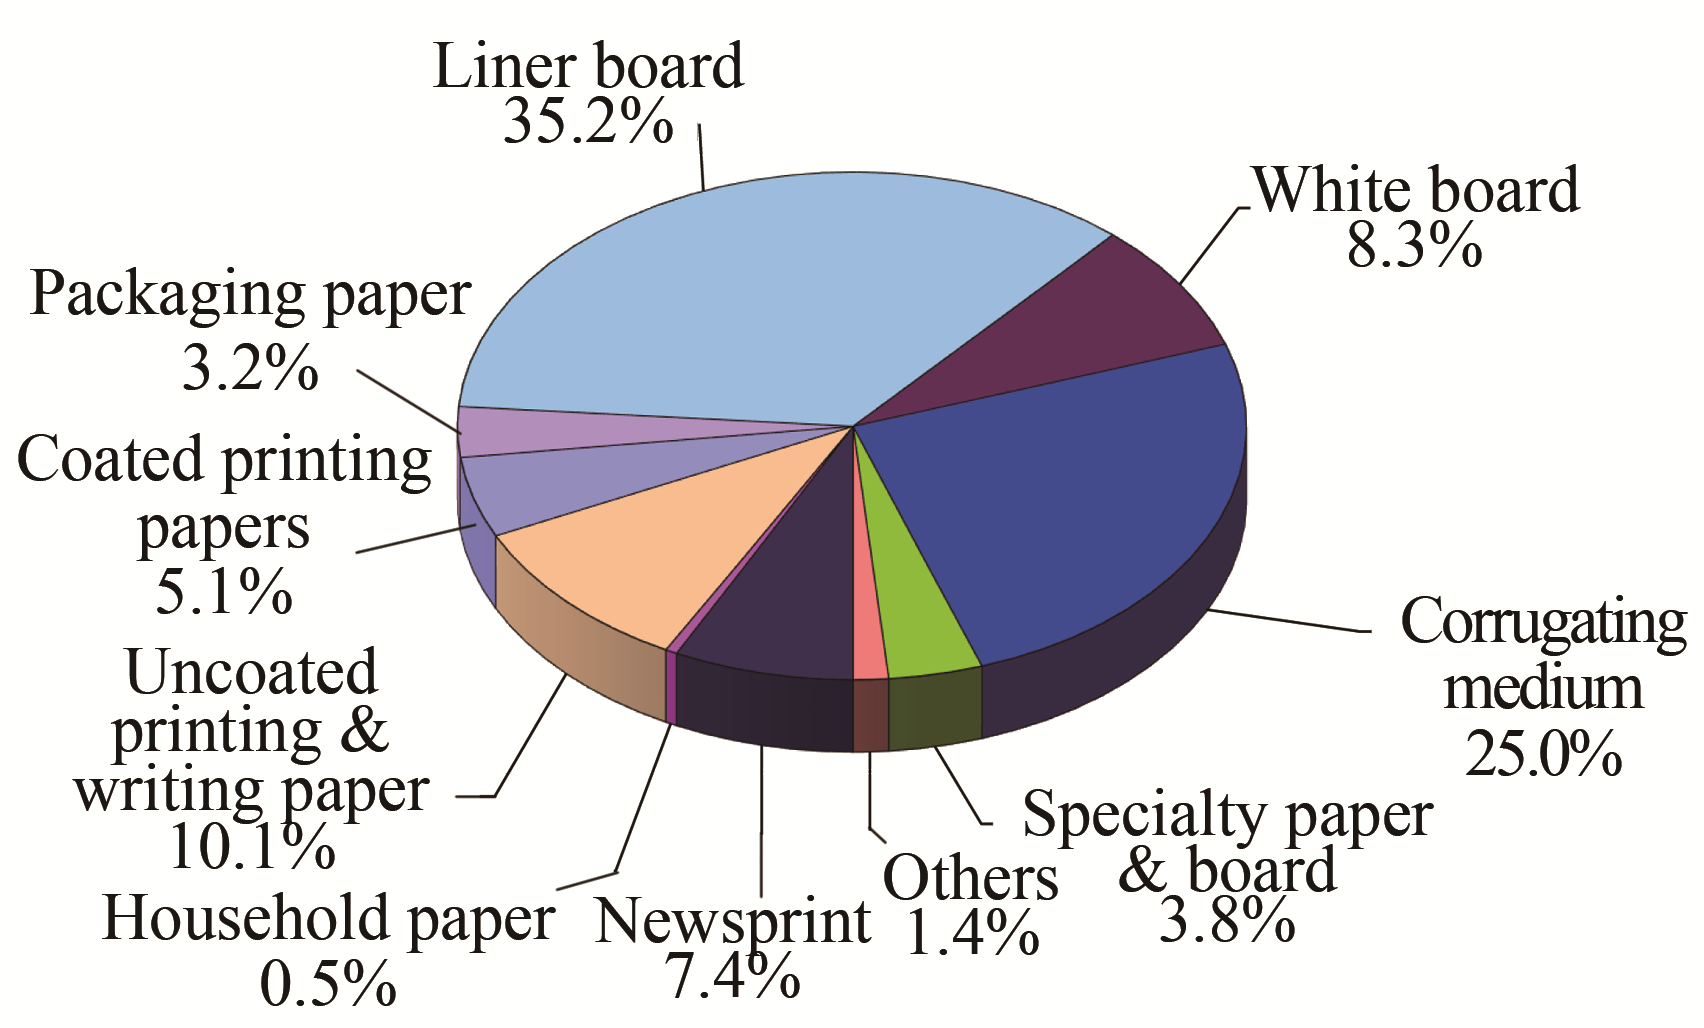
Fig. 21 Shares of imported paper & board grades in 2019
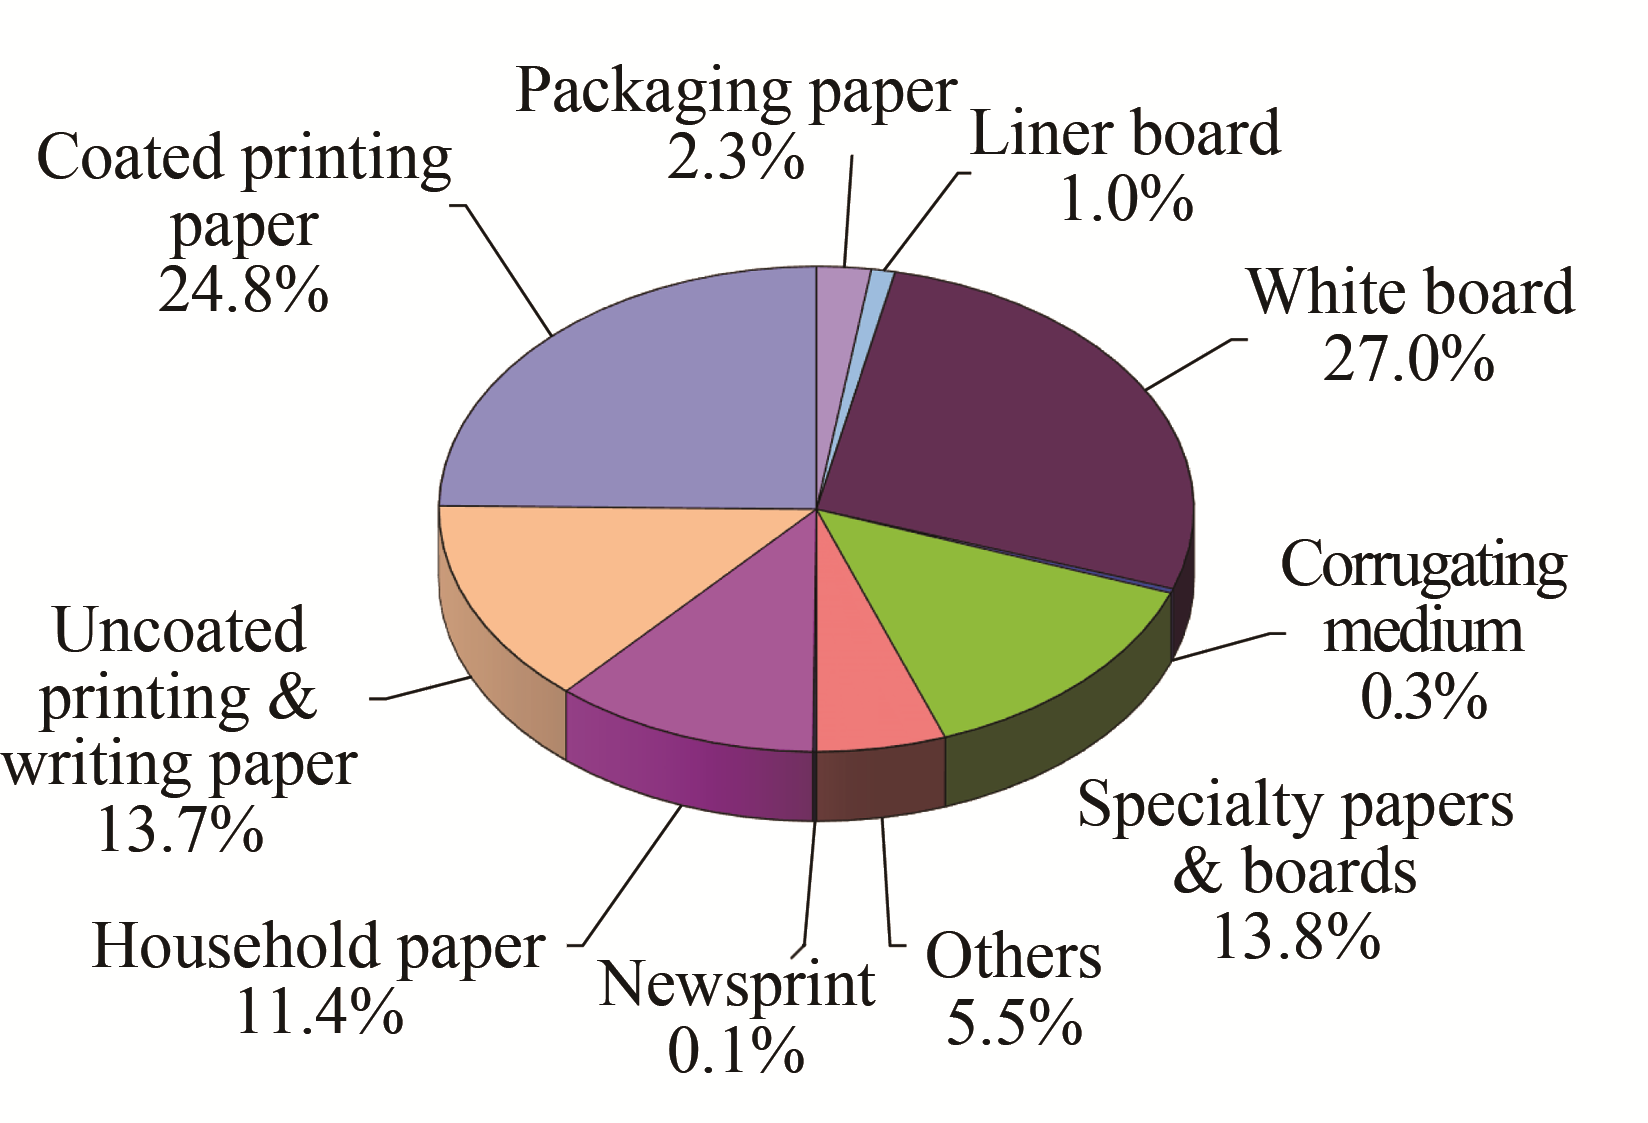
Fig. 22 Share of exported paper & board grades in 2019
The imports and exports of major paper grades from 2010 to 2019 are showed in Figs.
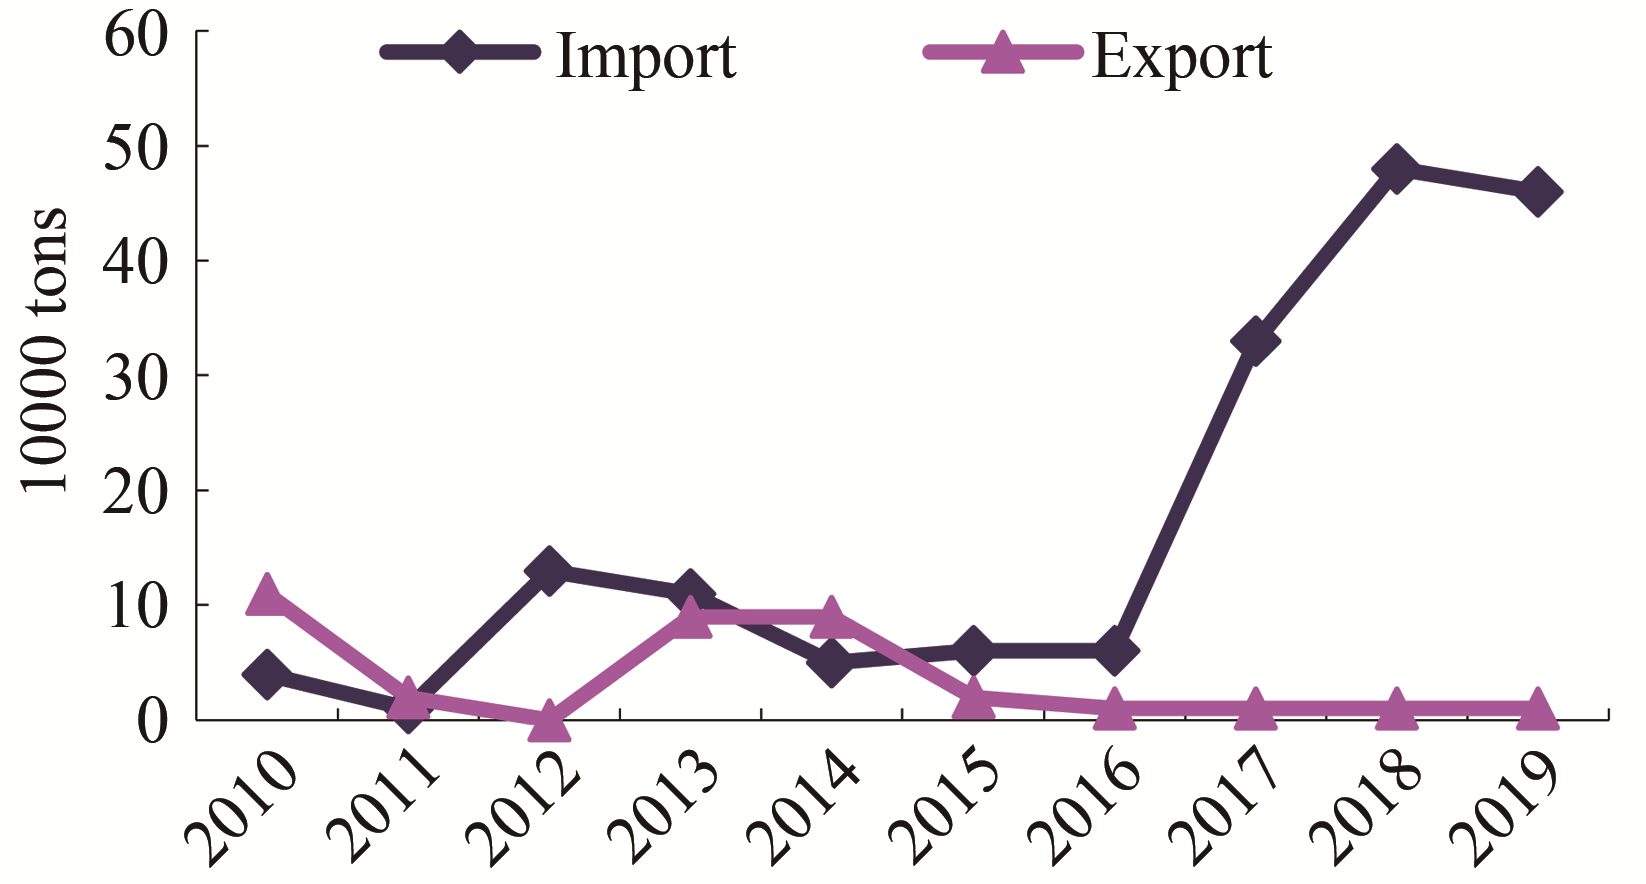
Fig. 23 Import and export of newsprint (2010-2019)
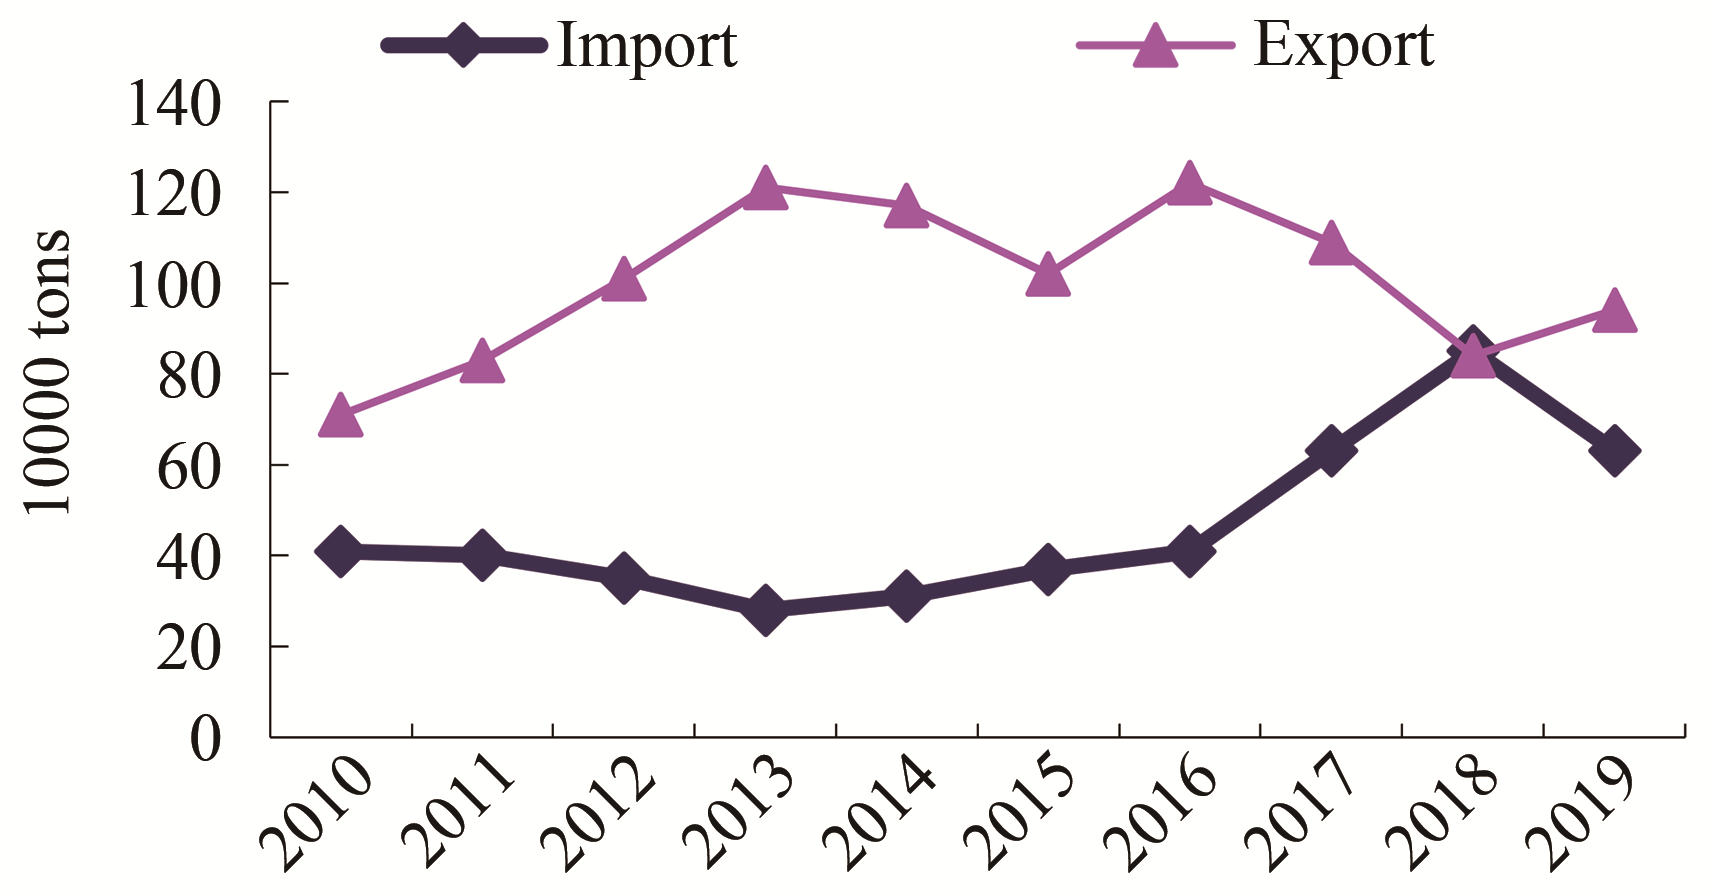
Fig. 24 Import and export of uncoated printing & writing paper (2010-2019)
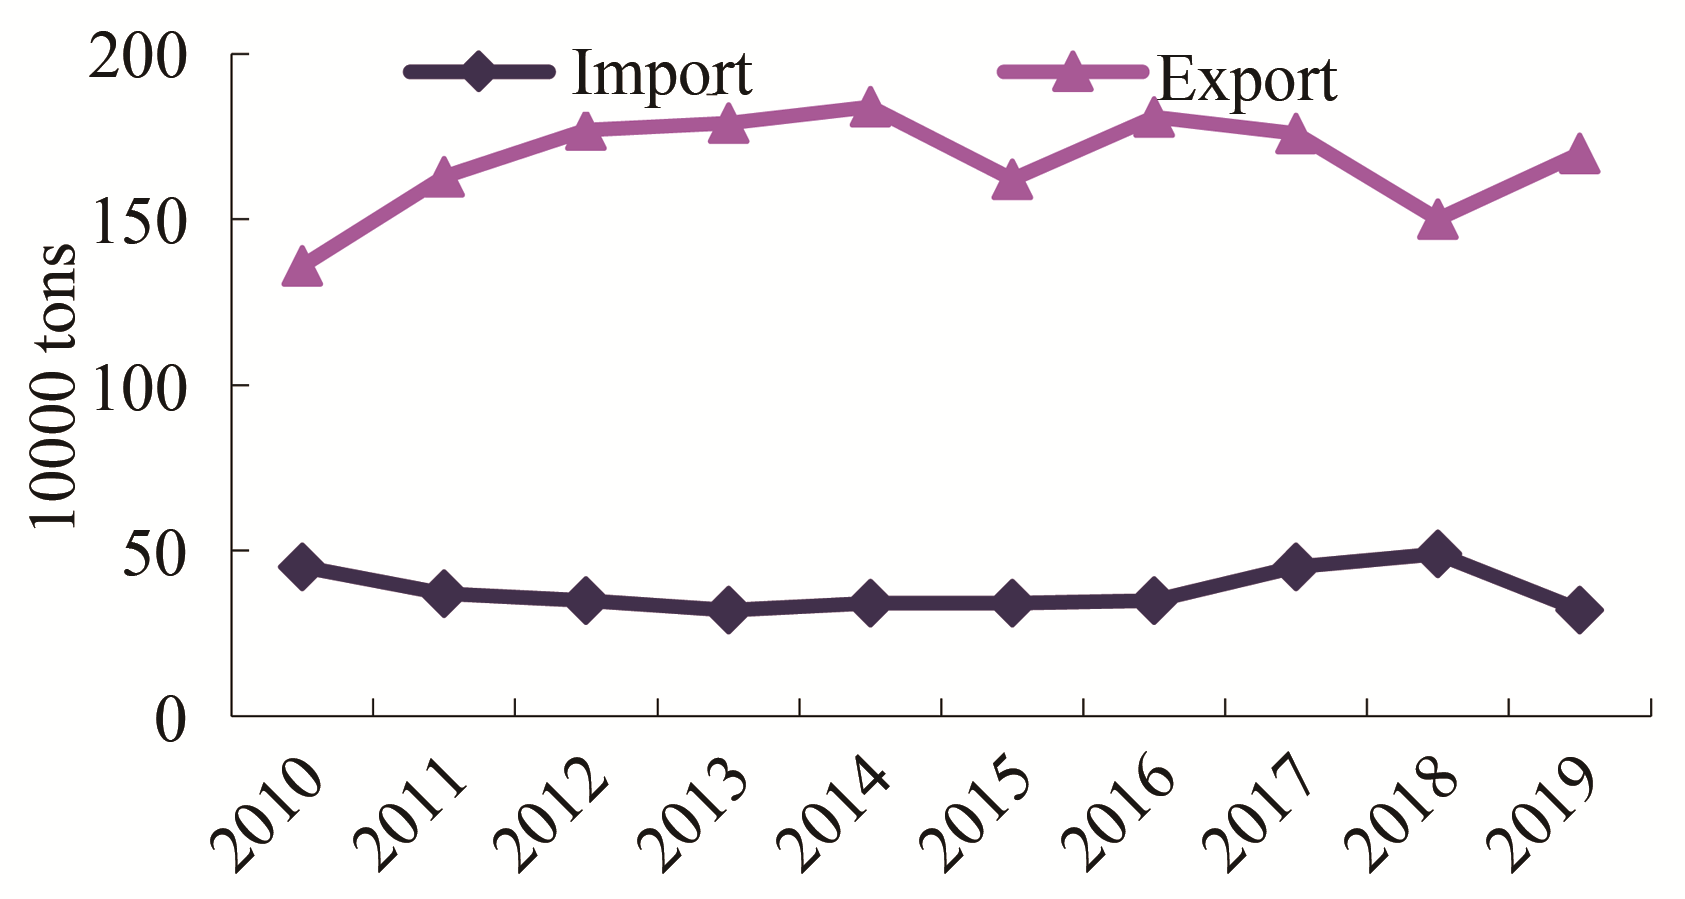
Fig. 25 Import and export of coated printing paper(2010-2019)
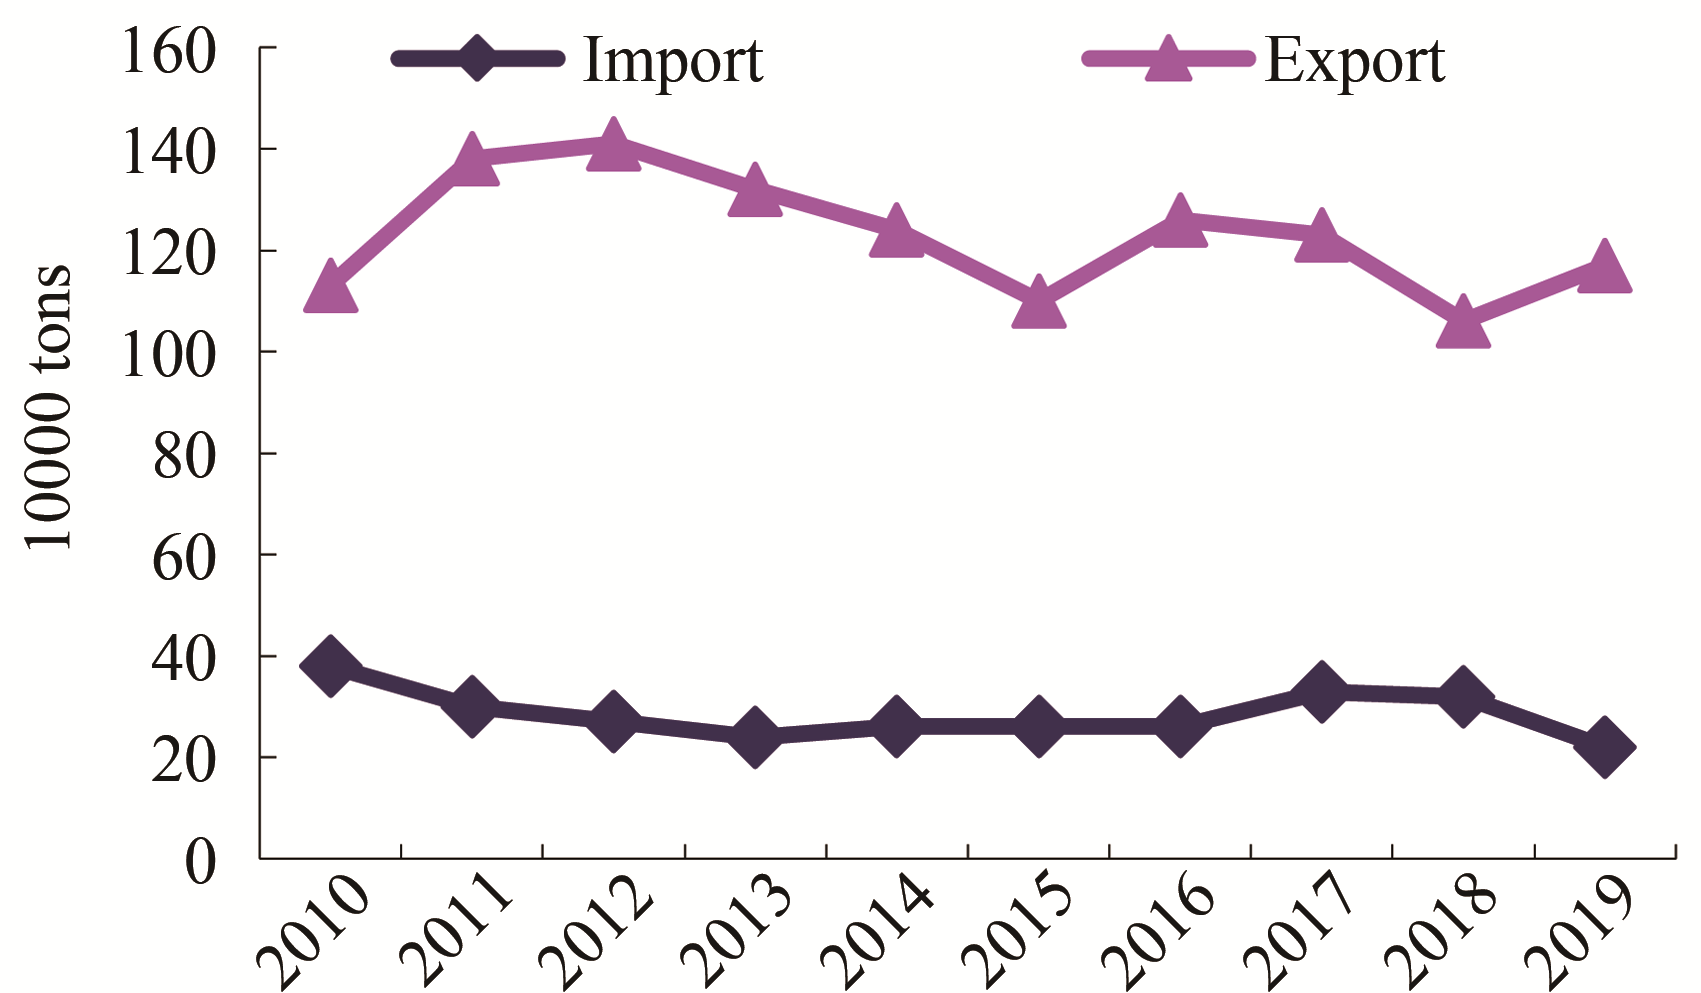
Fig. 26 Import and export of coated art paper (2010-2019)
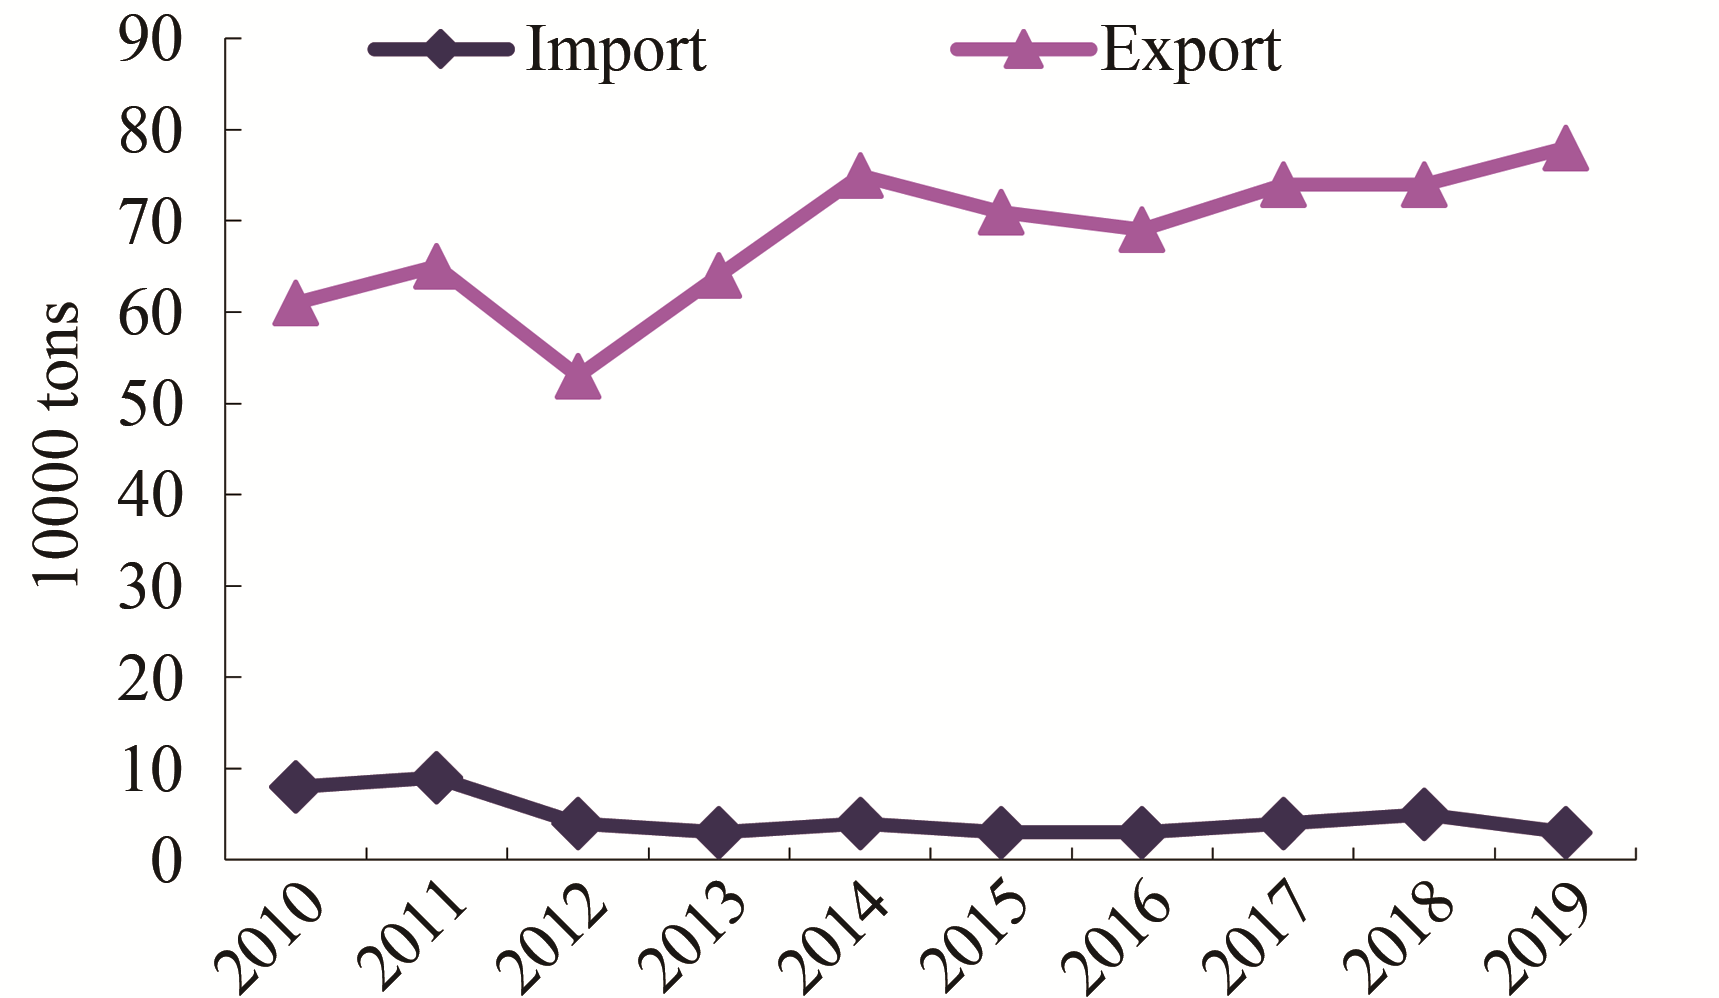
Fig. 27 Import and export of household paper (2010-2019)
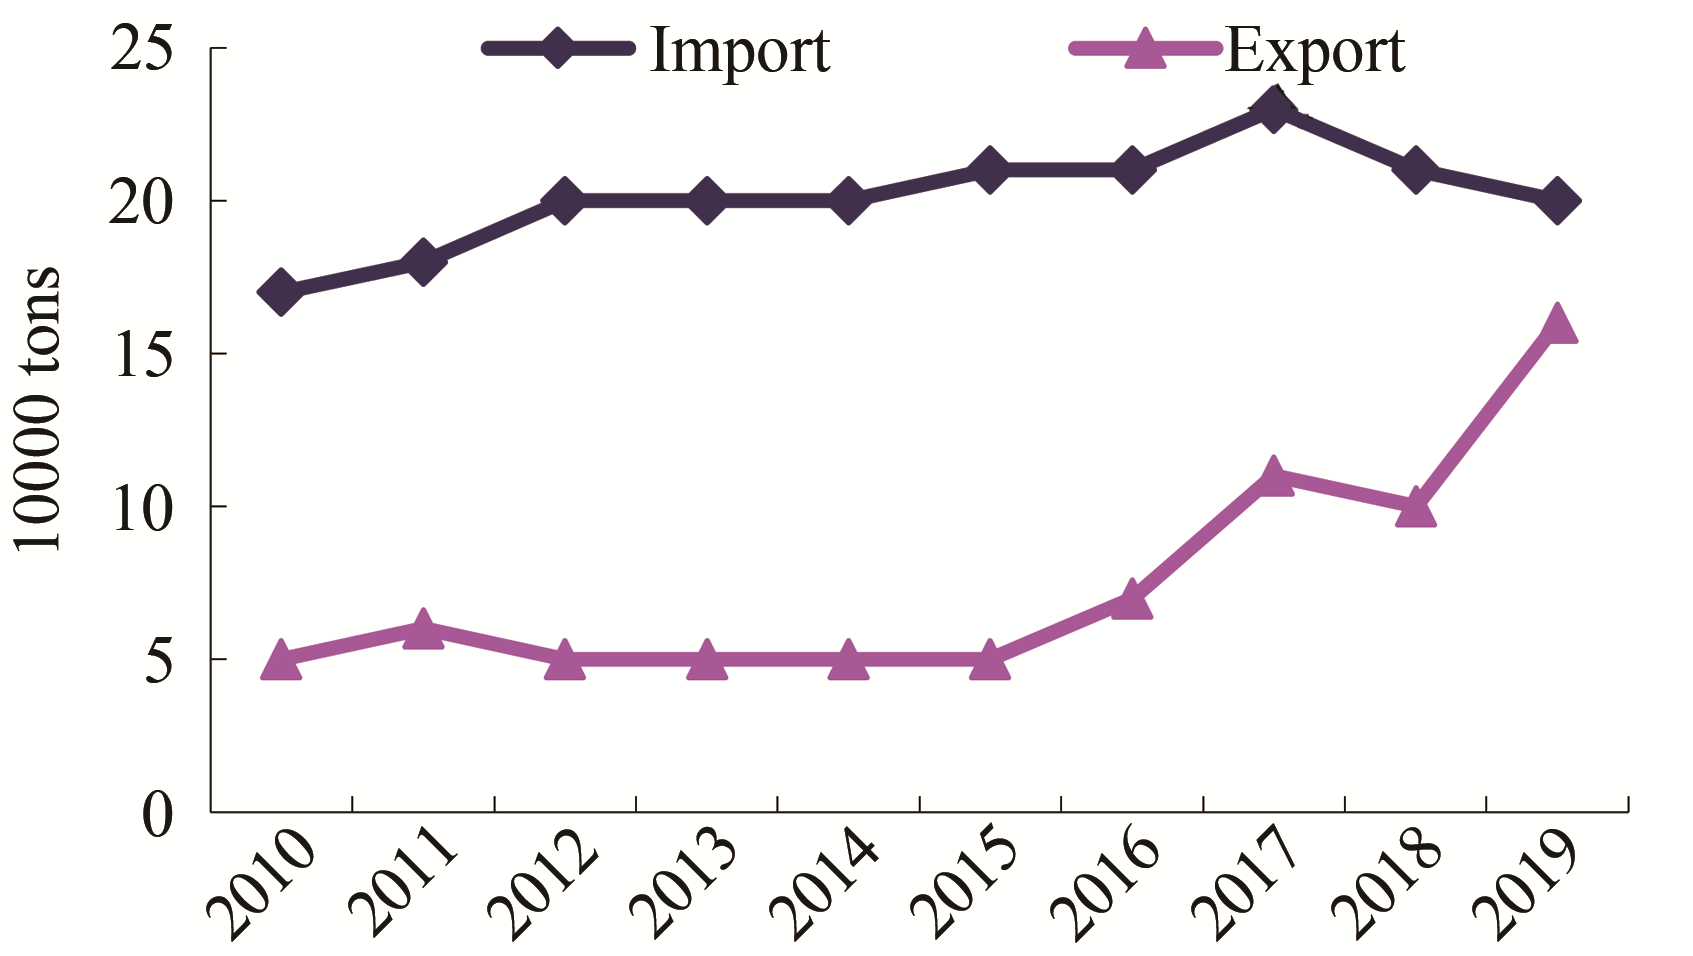
Fig. 28 Import and export of packaging paper (2010-2019)
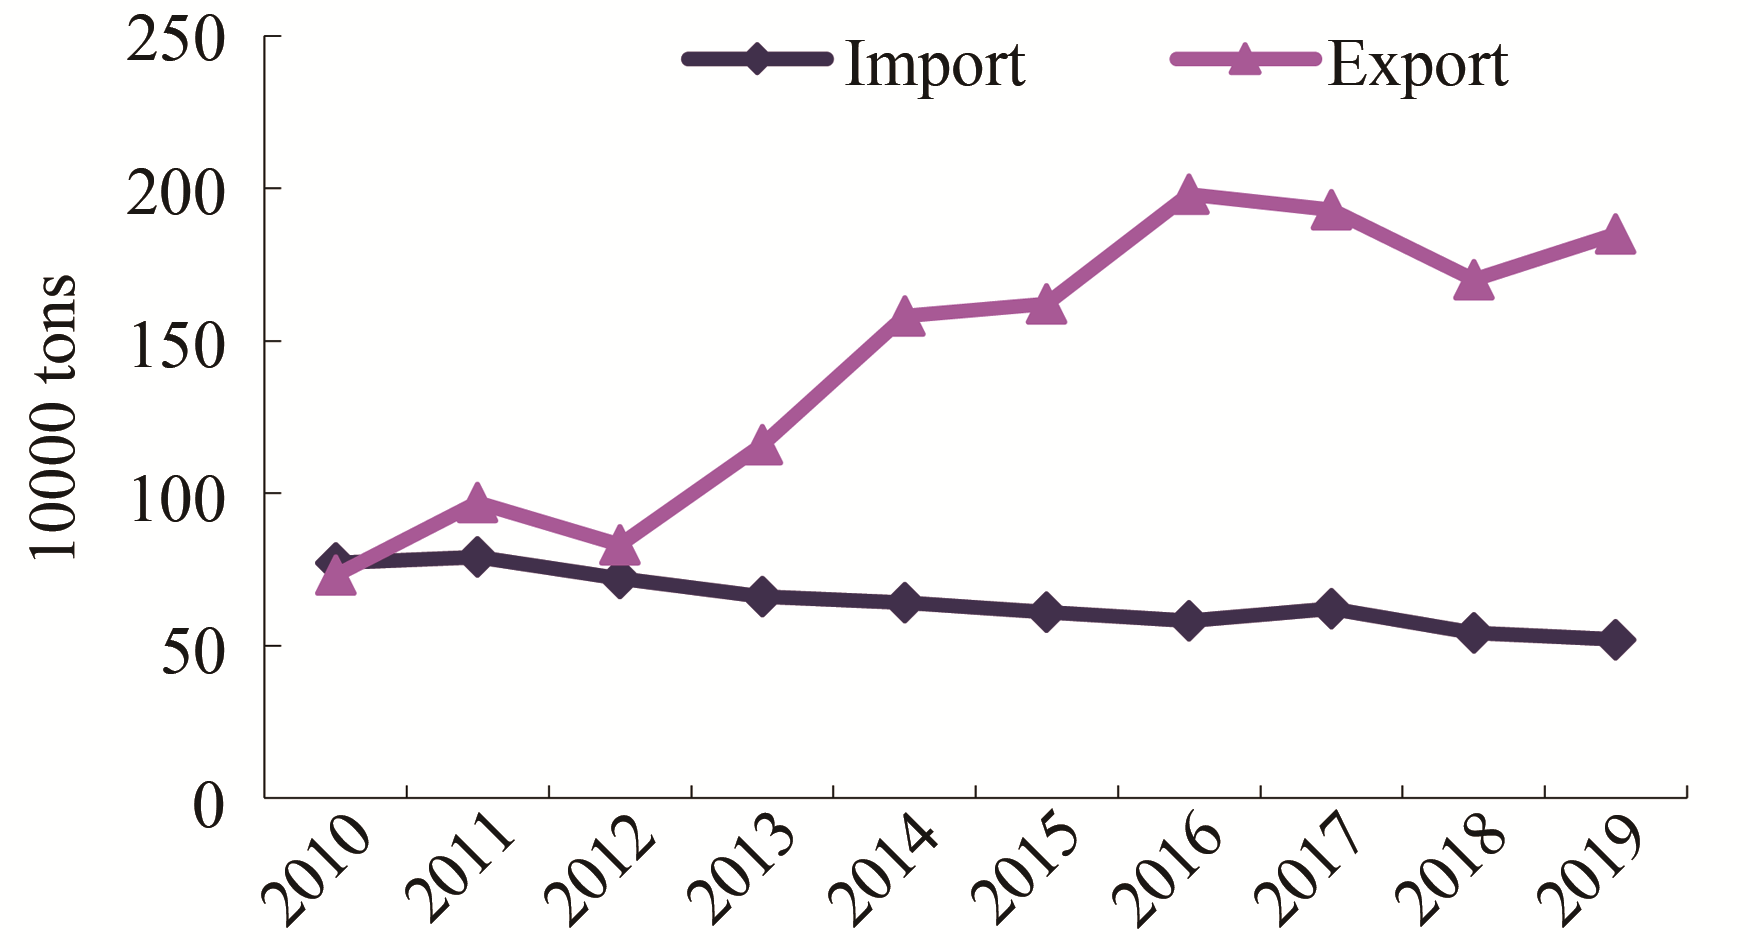
Fig. 29 Import and export of white board (2009-2018)
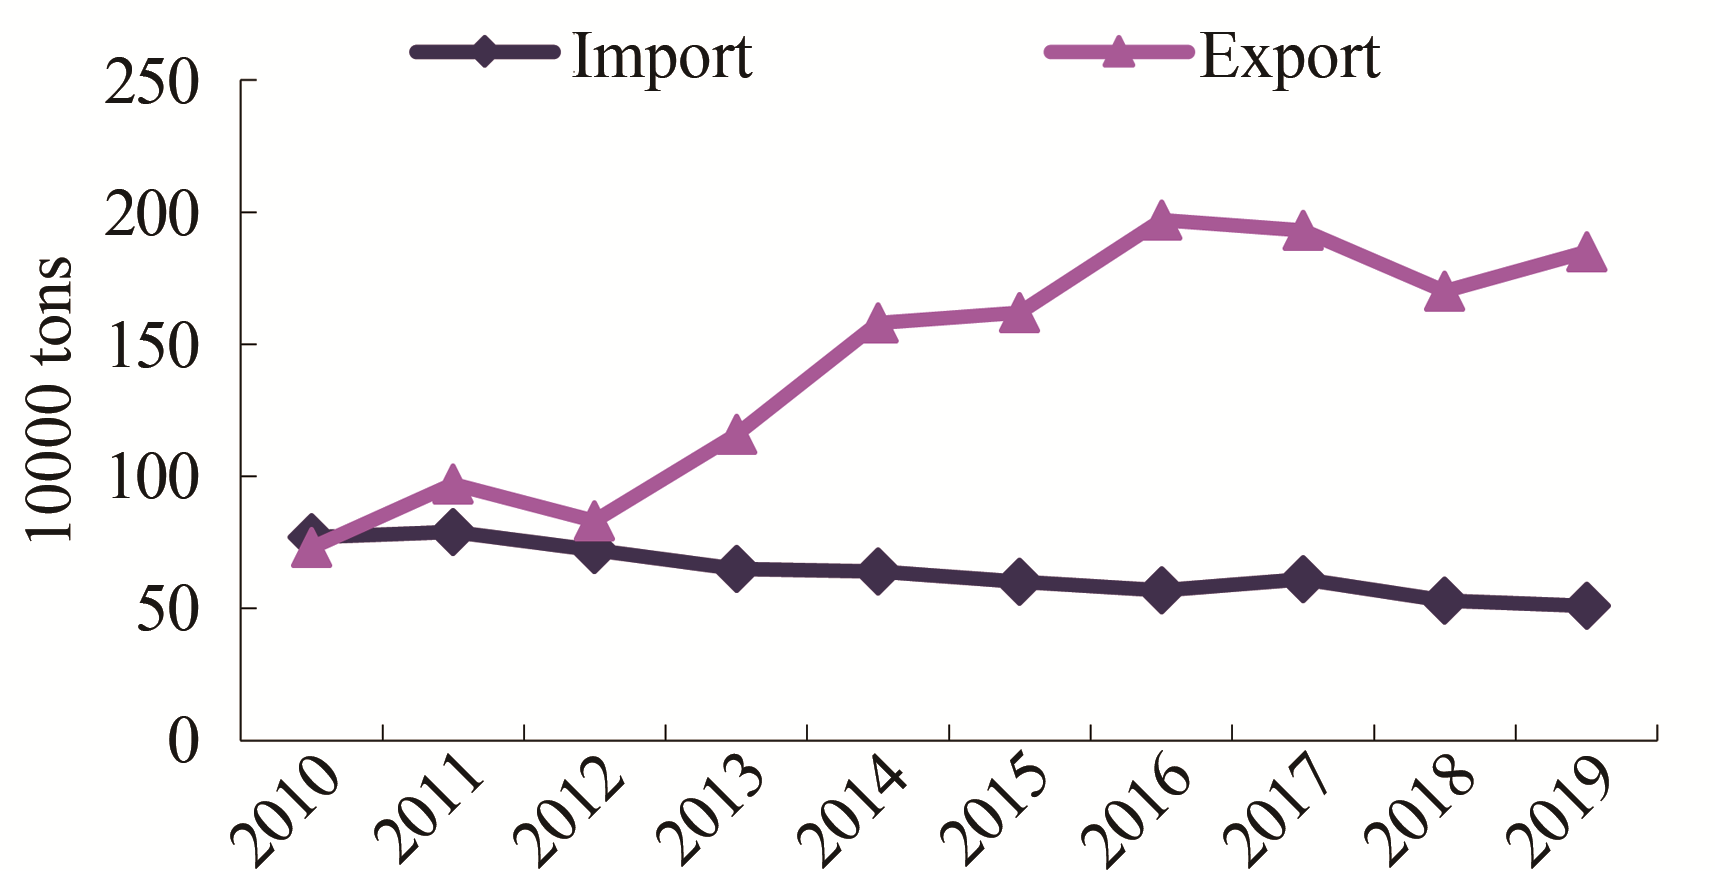
Fig. 30 Import and export of coated white board (2010-2019)
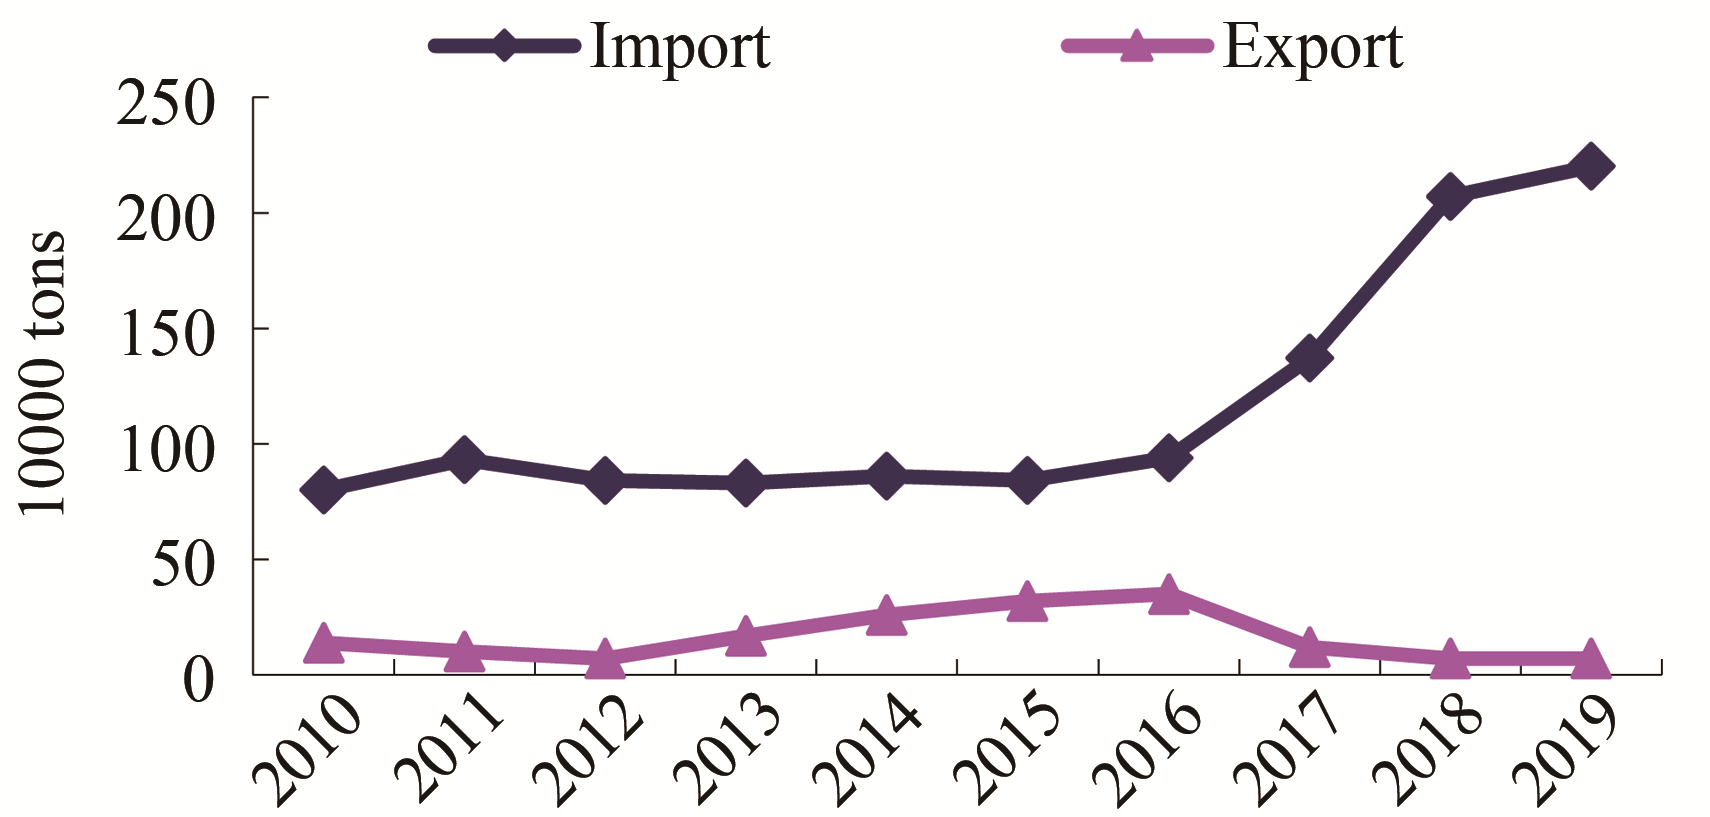
Fig. 31 Import and export of liner board (2010-2019)
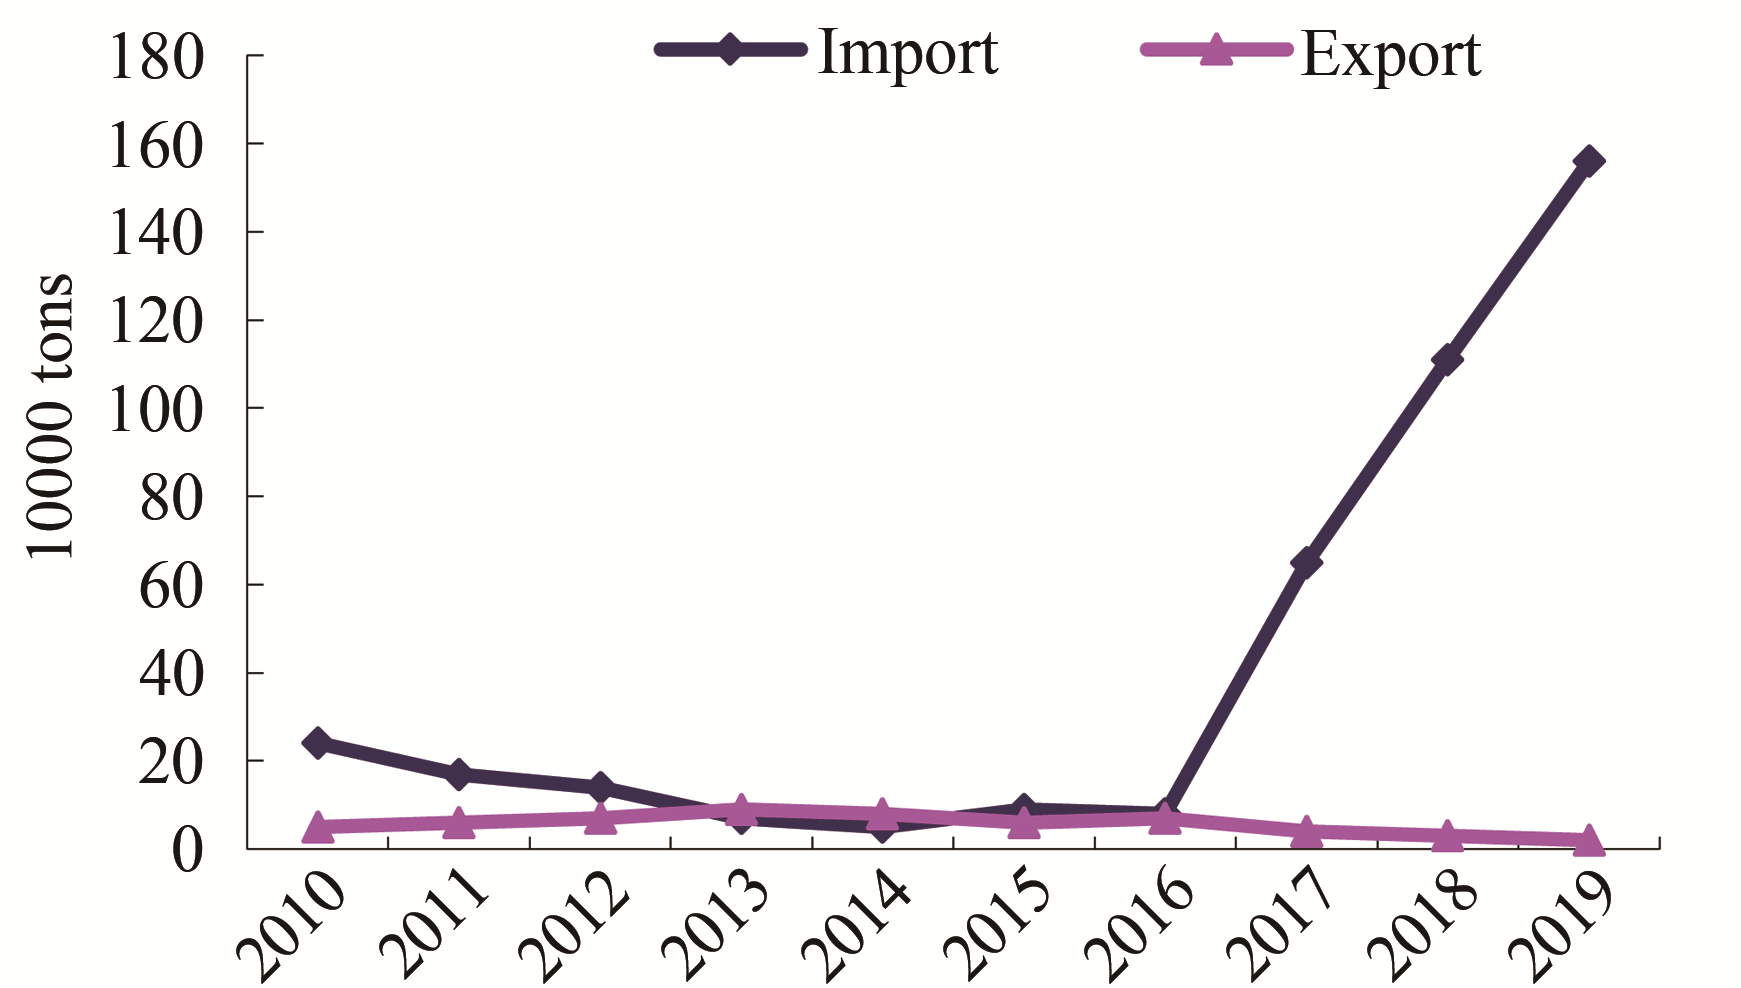
Fig. 32 Import and export of corrugating medium (2010-2019)
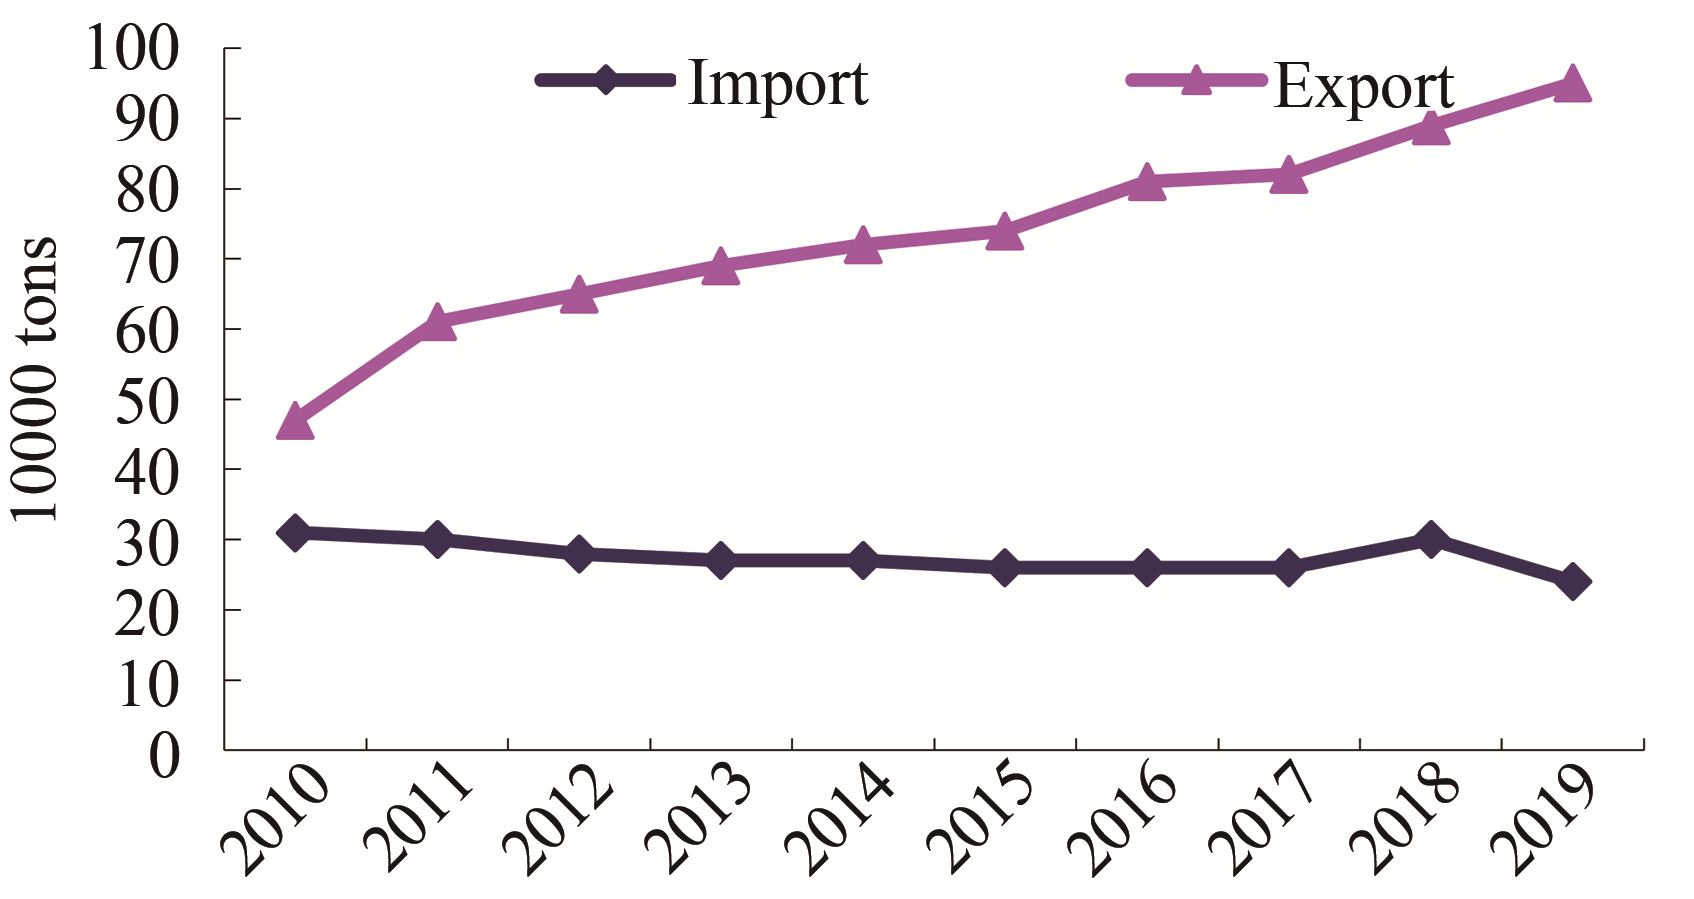
Fig. 33 Import and export of specialty paper & board (2010-2019)
(1) Newsprint: The import exceeded the export and the net import amount was 450000 tons in 2019, as shown in
(2) Uncoated printing & writing paper: The export exceeded the import and the net export amount was 310000 tons in 2019, as shown in
(3) Coated printing paper: The export exceeded the import and the net export amount was 1.38 million tons in 2019, as shown in
And in which, the export of coated art paper exceeded the import and the net export amount was 0.95 million tons in 2019, as shown in
(4) Household paper: The export exceeded the import and the net export amount was 0.75 million tons in 2019, as shown in
(5) Packaging paper: The import exceeded the export and the net import amount was 0.04 million tons in 2019, as shown in
(6) White board: The export exceeded the import and the net export amount was 1.33 million tons in 2019, as shown in
In which, the export of coated white board exceeded import and the net export amount was 1.34 million tons, as shown in
(7) Liner board: The import exceeded the export and the net import amount was 2.13 million tons in 2019, as shown in
(8) Corrugating medium: The import exceeded the export and the net import amount was 1.54 million tons in 2019, as shown in
(9) Specialty paper & board: The export exceeded the import and the net export amount was 0.71 million tons in 2019, as shown in
The imports and exports of paper products from 2010 to 2019 are showed in
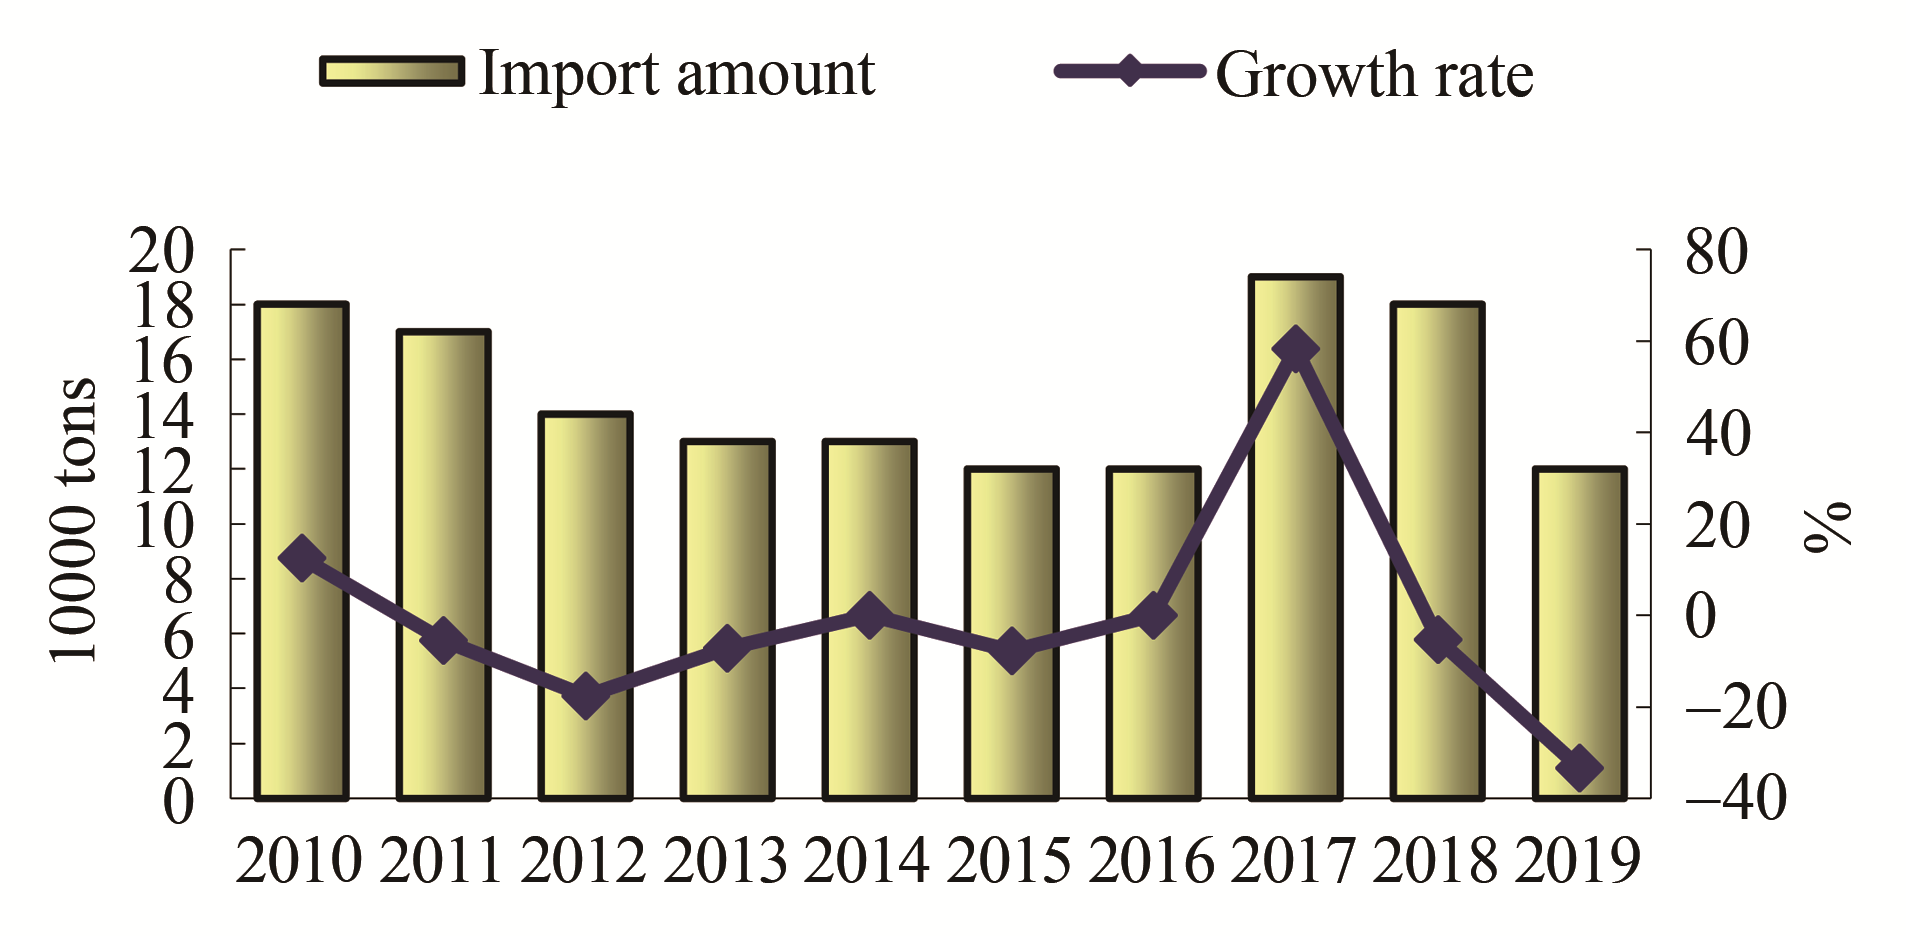
Fig. 34 Import of paper products (2010-2019)
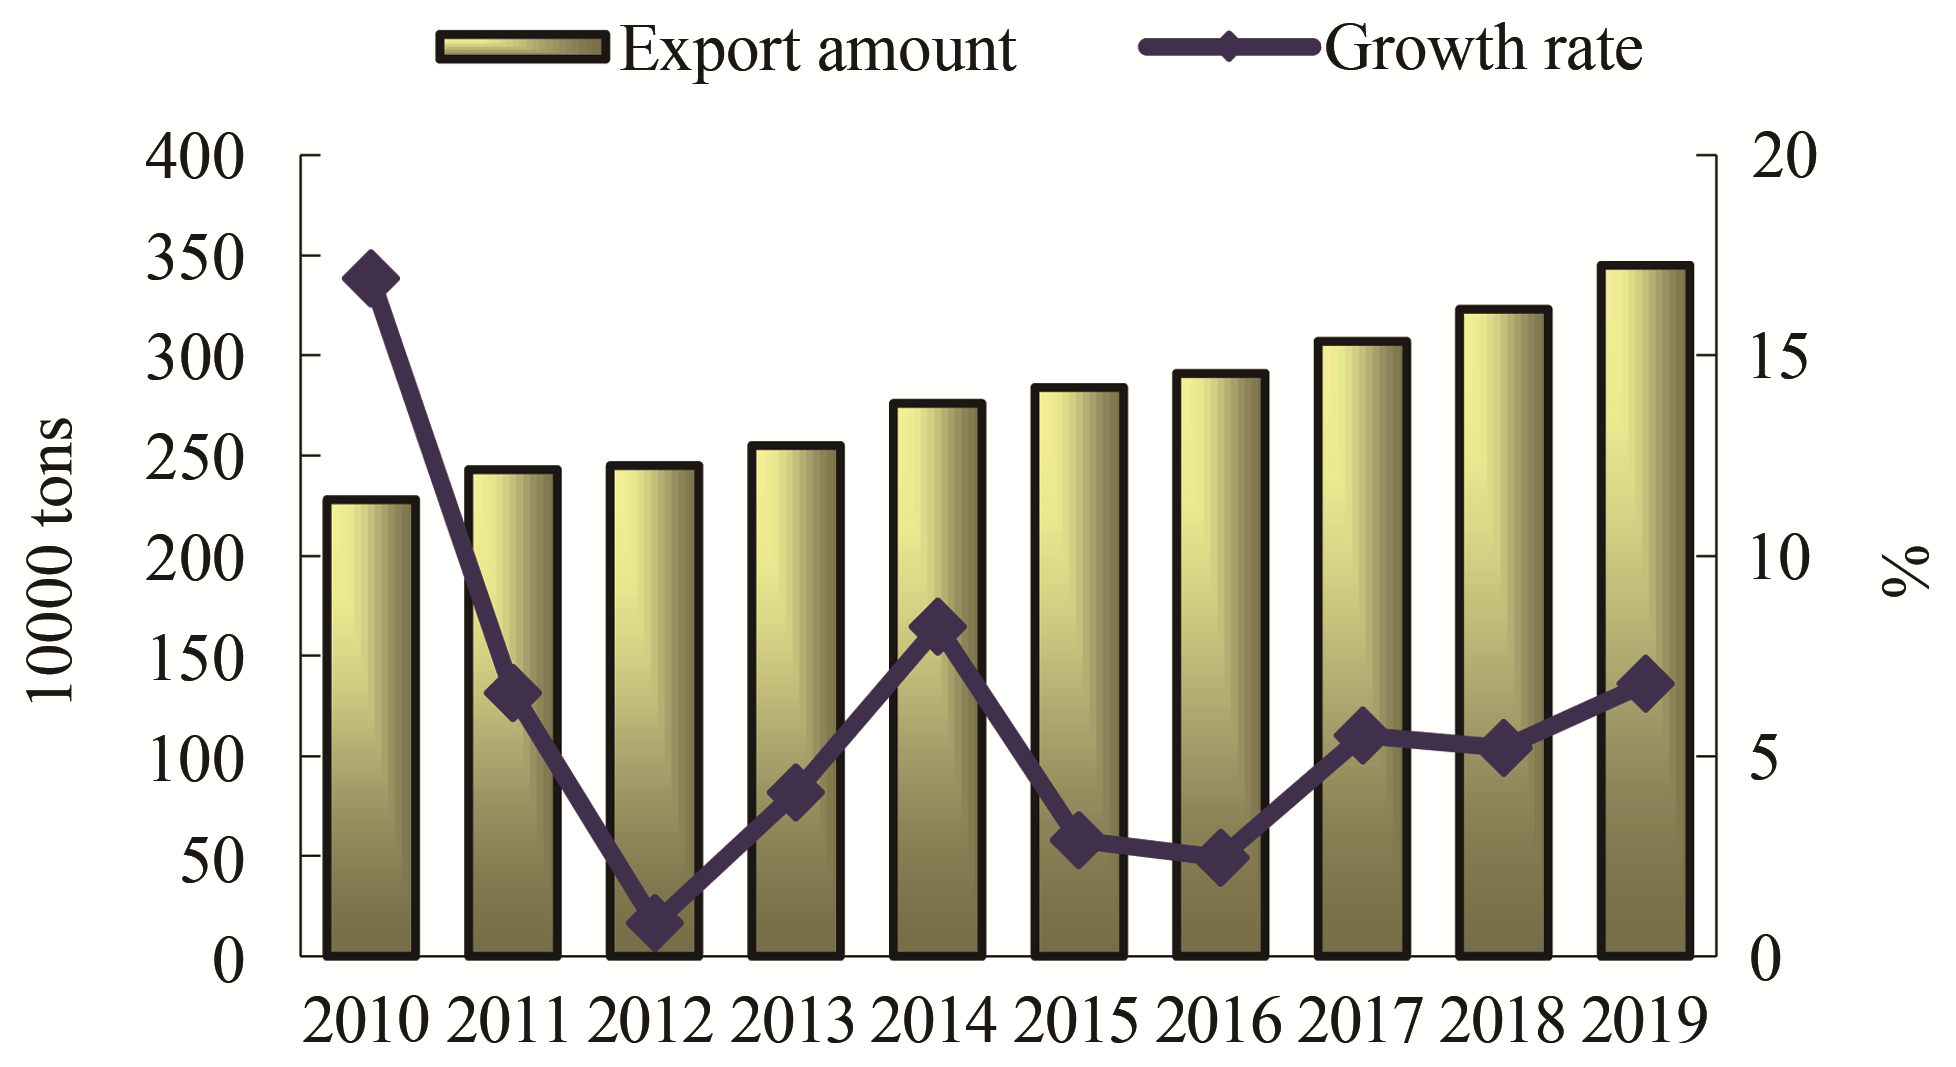
Fig. 35 Export of paper products (2010-2019)
(1) The import amount of paper products was 0.12 million tons in 2019, decreased by 60000 tons or 33.33% compared with 2018, as shown in
(2) The export amount of paper products was 3.45 million tons, increased by 6.81% or 220000 tons compared with 2018, as shown in
According to the survey of CPA, in 2019, the total paper & board production of 11 provinces (regions, cities) in eastern China accounted for 74.3% of the nation’s gross, the total production of the 8 provinces (regions,cities) in central China accounted for 16.3%, and the total production of the 12 provinces (regions, cities) in western China accounted for 9.4%, as shown in
*Data source: CPA.
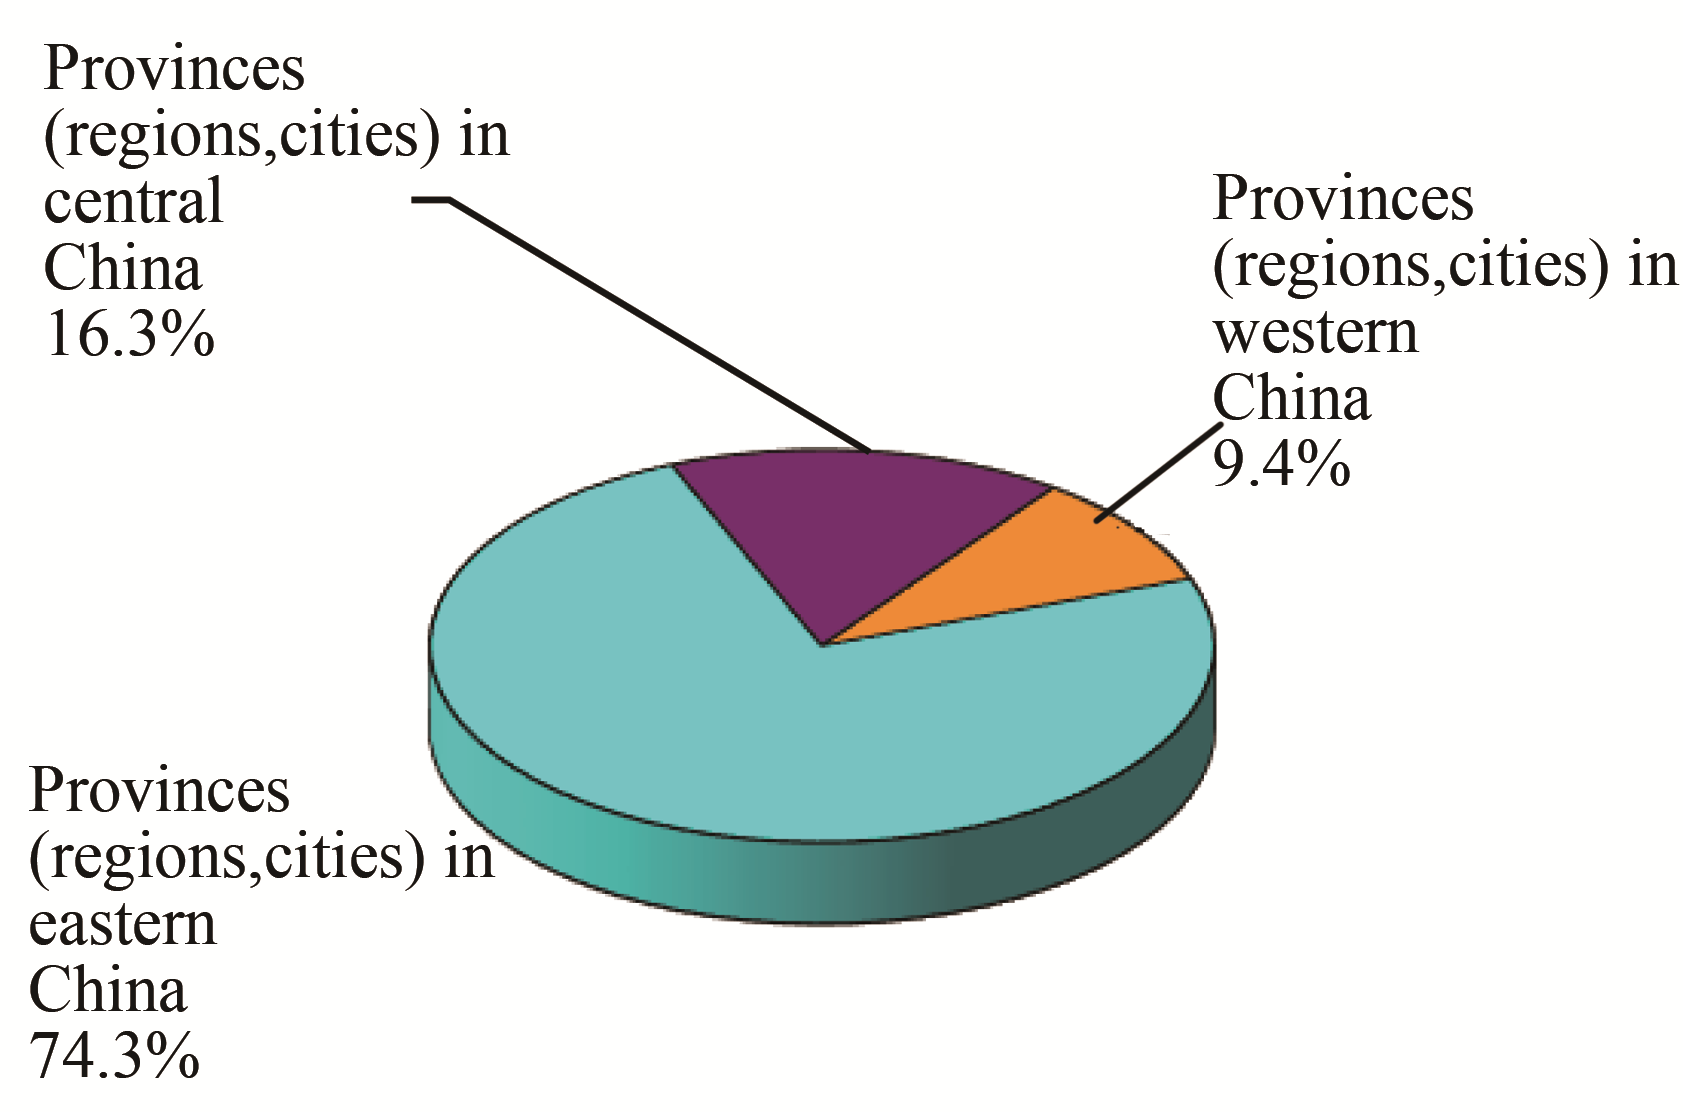
Fig. 36 Regional distribution of China's paper industry in 2019
There were 17 provinces (regions, cities) where the paper & board production exceeded 1 million tons in 2019, they were Guangdong, Shandong, Zhejiang, Jiangsu, Fujian, He‘nan, Hubei, Anhui, Chongqing, Sichuan, Guangxi, Hebei, Jiangxi, Hu‘nan, Tianjin, Hainan and Liaoning, their total production reached 104.12 million tons, accounted for 96.72% of nation’s gross, as shown in

Fig. 37 The production share of major provinces in 2019
Top 30 paper enterprises by production in 2019 are shown in
*Based on the collected data.
;*Data source: CPA.
In 2019, the paper industry has overcome unfavorable factors such as a marked increase in risks and challenges, a decline in operating income and profits, an increase in production and operational difficulties and the intensification of competition in the face of a complex and volatile domestic and international economic situation. The overall production and operation of the paper industry have been basically kept stable by increasing innovation, broadening the source channels of fiber raw materials, reducing operating costs, adapting to trends, adjusting the structure, and ensuring market supply.